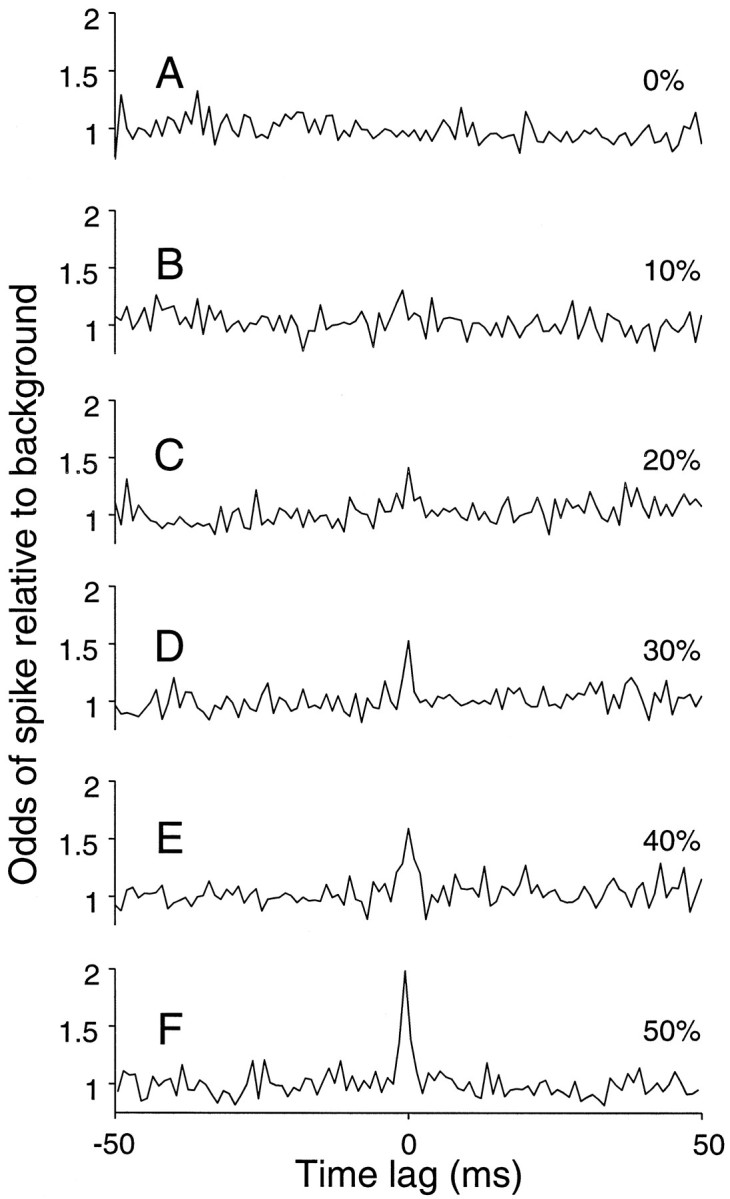
Fig. 8.

Cross-correlation response histograms from a pair of simulated neurons. The correlograms represent the relative change in response from one neuron when a spike has occurred in the other neuron at a time lag indicated along the abscissa. The spike train for each neuron was simulated using the random walk counting model with 300 excitatory and 300 inhibitory inputs. Plots A–F differ in the amount of common input that is shared by the simulated pair. A small central peak in the correlogram is apparent when the pair of neurons share 20–50% of their inputs.
