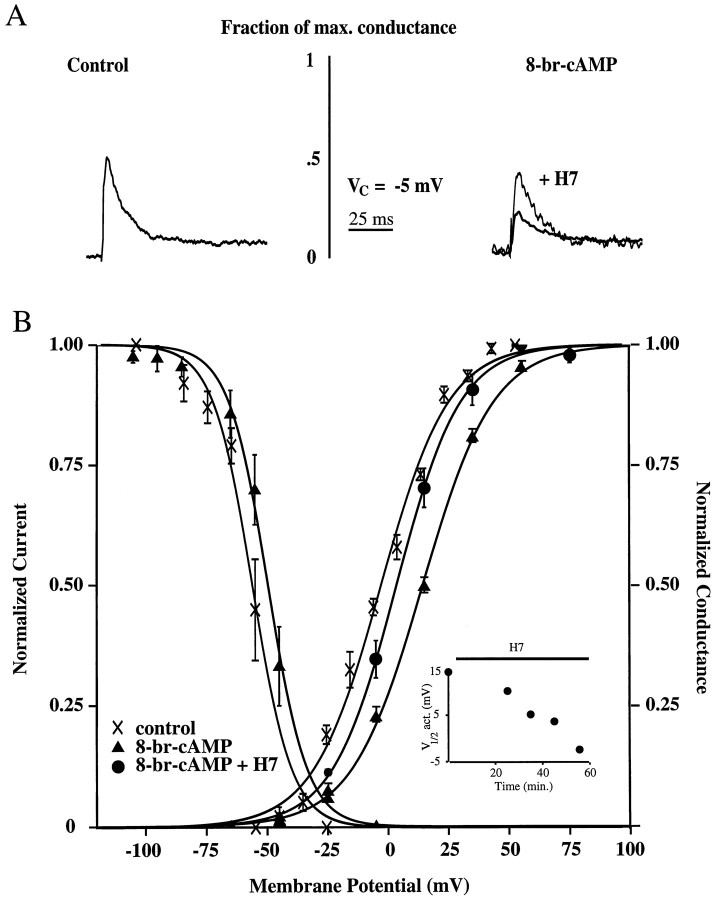
Fig. 2.
Downregulation of transient channel activation by PKA activation. A, Representative example of isolated transient currents for the control condition and for that with 100 μm 8-br-cAMP included in the patch pipette, scaled to demonstrate their fraction of maximal conductance, for a step from −85 to −5 mV. Under control conditions, nearly 50% of the available channels are activated by this voltage step. With PKA activation, only ∼25% are activated. In the same patch, subsequent H7 application returned the fraction of channels activated back toward control levels.B, Steady-state activation and inactivation curves for control and 8-br-cAMP conditions and an activation curve for the condition with 8-br-cAMP in the pipette after bath application of 300 μm H7. Half-activation with 8-br-cAMP (V1/2 = +11 mV; n = 12) was shifted 13 mV to theright of control levels (V1/2 = −2 mV;n = 12). There was also a small (6 mV) shift in the inactivation curve with 8-br-cAMP (V1/2 = −50 mV and n = 8 vs V1/2 = −56 mV andn = 5 for controls). Bath application of H7 shifted the 8-br-cAMP curve back toward control levels (V1/2= +3.5 mV after 30 min in H7; n = 3).Inset, Time course of reversal of PKA effect by H7 application (top horizontal bar). The activation and inactivation curves under control conditions are nearly identical to those reported previously for transient K+ channels in distal dendrites (Hoffman et al., 1997). Curves (here and see Figs.3, 5, 6) are least-square fits of the data to Boltzmann functions (see Materials and Methods).

