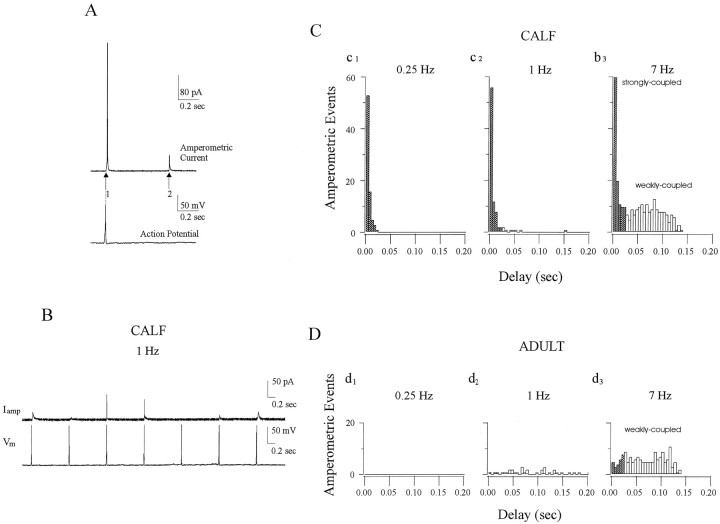
Fig. 4.
Strong stimulus–secretion coupling is predominant in calf AC cells but not in adult AC cells. To quantitate the delay between the onset of stimulation and detection of amperometric spikes from calf and adult AC cells, we analyzed latency histograms.A, In such histograms, “coupling” is defined as the degree of coincidence between APs and the subsequent amperometric spike(s). The time from the peak of the AP (vertical dashed line) to the beginning of a current spike (indicated here byarrows 1 and 2) is termed latency, and these are collected and displayed as latency histograms (Chow et al., 1992). B, Representative amperometric spikes (Iamp) generated from a calf AC cell in response to trains of single APs (Vm) evoked at 1 Hz illustrate the coupling between APs (bottom trace) and amperometric spikes (top trace). C, Latency histograms of multiple events collected from calf AC cells stimulated by single APs applied at 0.25 Hz (c1), 1 Hz (c2), or 7 Hz (c3), respectively. Filled barsrepresent “strongly coupled” signals with latency <25 msec, whereas open bars represent “weakly coupled” signals (latency 25–143 msec). At 0.25 Hz, nearly all amperometric spikes (97%) are strongly coupled; at 1 Hz, 83% are strongly coupled, whereas the remaining events form a dispersed tail. At 7 Hz, 40% of events are strongly coupled, whereas the other 60% are weakly coupled.D, Latency histograms from adult AC cells stimulated under conditions identical to those shown in C. No events were apparent at 0.25 Hz (d1), and only a plateau component of latencies from 0 to 143 msec was observed at 1 and 7 Hz (d2,d3). Only 4 and 14% of the total events had a latency <25 msec at 1 and 7 Hz, respectively. Latency histograms in C and D were determined from different cells stimulated by similar number of APs at each frequency, of which only 200 msec is shown 450 APs (c1, d1, 0.25 Hz), 490 APs (c2, d2, 1 Hz), and 490 APs (c3, d3, 7 Hz). Only amperometric events having 50–90% rise time faster than 3 msec were selected for these histograms.

