
Fig. 1.
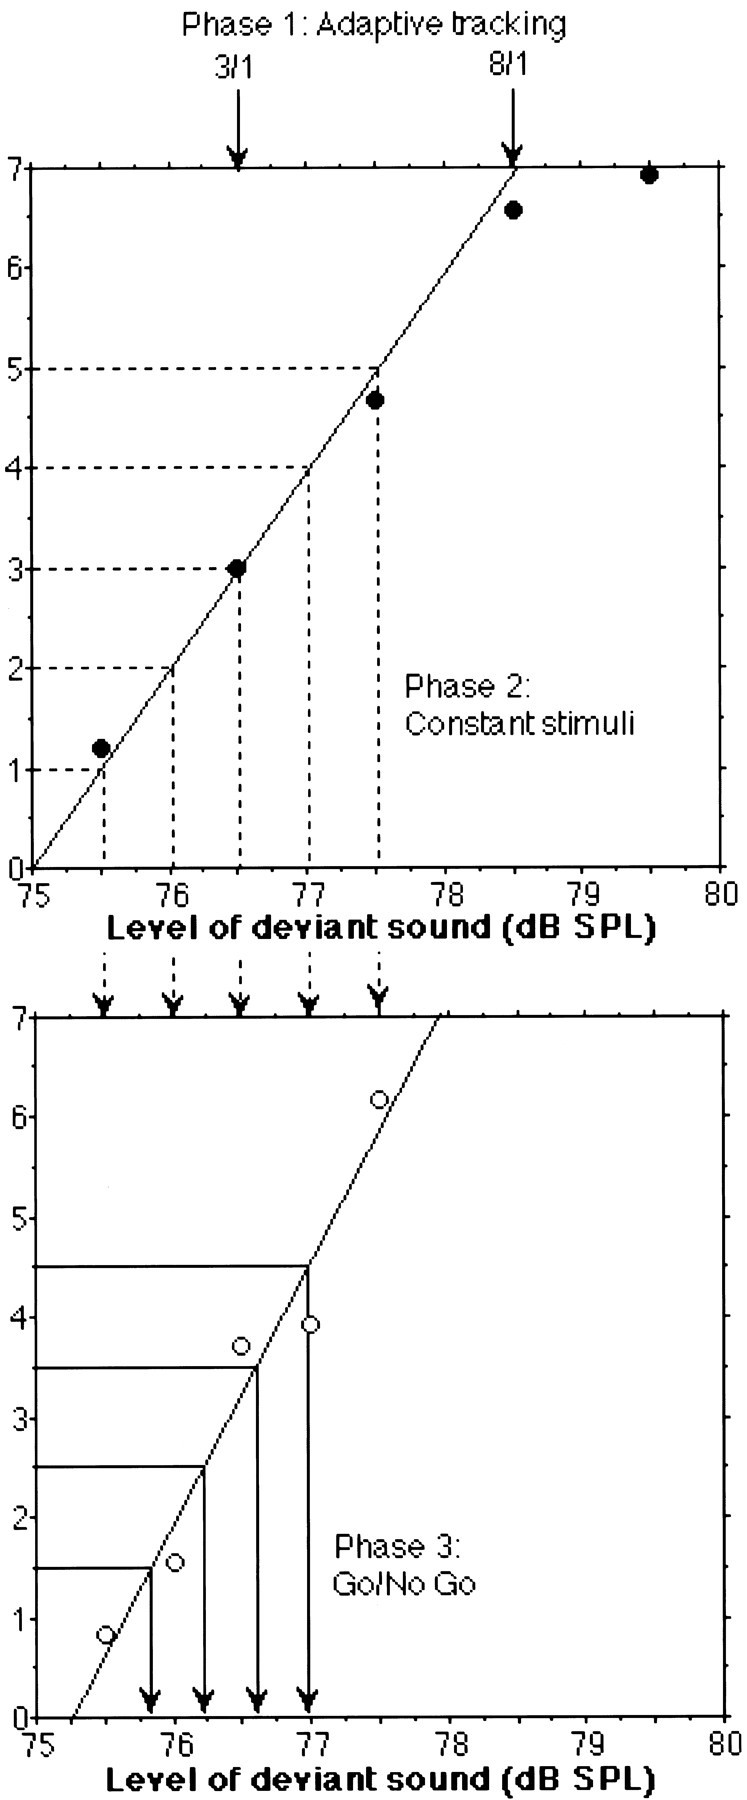
Psychophysical data for Subject 2. The two estimated thresholds from the three down/one up and eight down/one up adaptive procedures (Phase 1: Adaptive tracking, top panel) are shown with downward arrows. From these two values, the five stimulus levels for the constant stimuli procedure (Phase 2: Constant stimuli, top panel) were derived. A linear psychometric function (solid line) was fitted to the first four of the five data points obtained from this procedure (•). From this function, the five stimulus levels for the Go/No Go procedure (Phase 3: Go/No Go) were determined. A linear psychometric function (solid line) was then fitted to the five data points represented as open circles in the lower panel. Finally, the four stimulus levels used in the imaging study were derived from this latter function as indicated by the downward arrowsin the bottom panel.