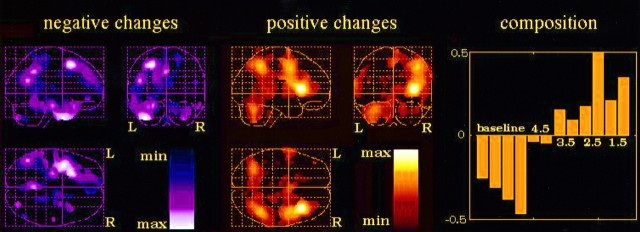
Fig. 3.
First eigenimage of the dataset (84 scans), explaining 56.4% of the variance. The corresponding activation/deactivation pattern is indicated by the left(negative changes) and middle (positive changes)panels. Composition of the eigenimage in terms of the scans corresponding to each experimental condition (four baseline scans; eight intensity discrimination tasks, two per d′ value) is indicated in the right panel.

