
Fig. 13.
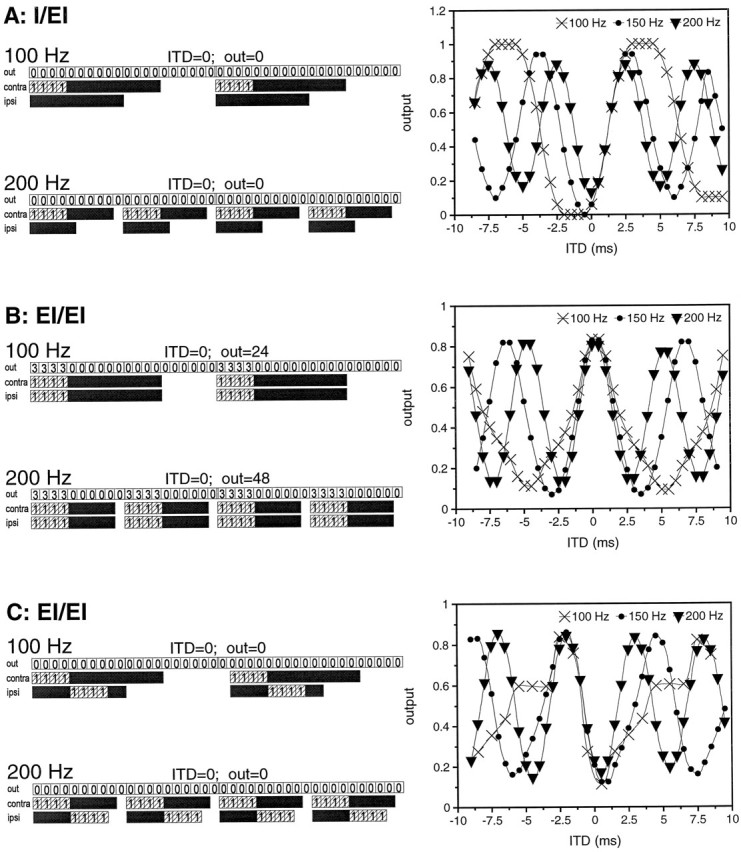
A simple model of ITD coding of MSO neurons in the free-tailed bat via the interaction of multiple excitatory and inhibitory inputs at 0 ITD. The left panels show the temporal interaction of the binaural MSO inputs for 100 and 200 Hz SAM. The right graphs show the calculated ITD function of the MSO neuron (calculated for 100 msec stimulus duration). Black bars indicate inhibition; hatched bars indicate excitation. Inhibition is weighted with −1 and excitation with +1. Facilitation is assumed to be 50%. The predictions for the three main MSO response types (I/EI, EI/EI with symmetric timing, EI/EI with asymmetric timing) are shown in the centered ITD functions. For details, see text.