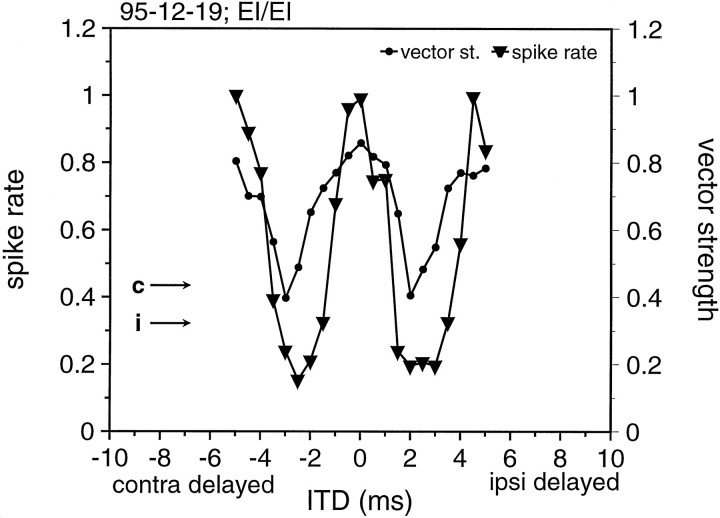
Fig. 4.
ITD functions from the neuron shown in Figure 2, again in response to 200 Hz SAM. The triangles give the normalized spike rate as a function of ITD; the dotsgive the calculated vector strength as a function of ITD. Note that a 5 msec ITD equals one cycle of the 200 Hz SAM. Both functions were calculated from 20 stimulus repetitions at each ITD. Thearrows give the response to monaural stimulation.

