
Fig. 7.
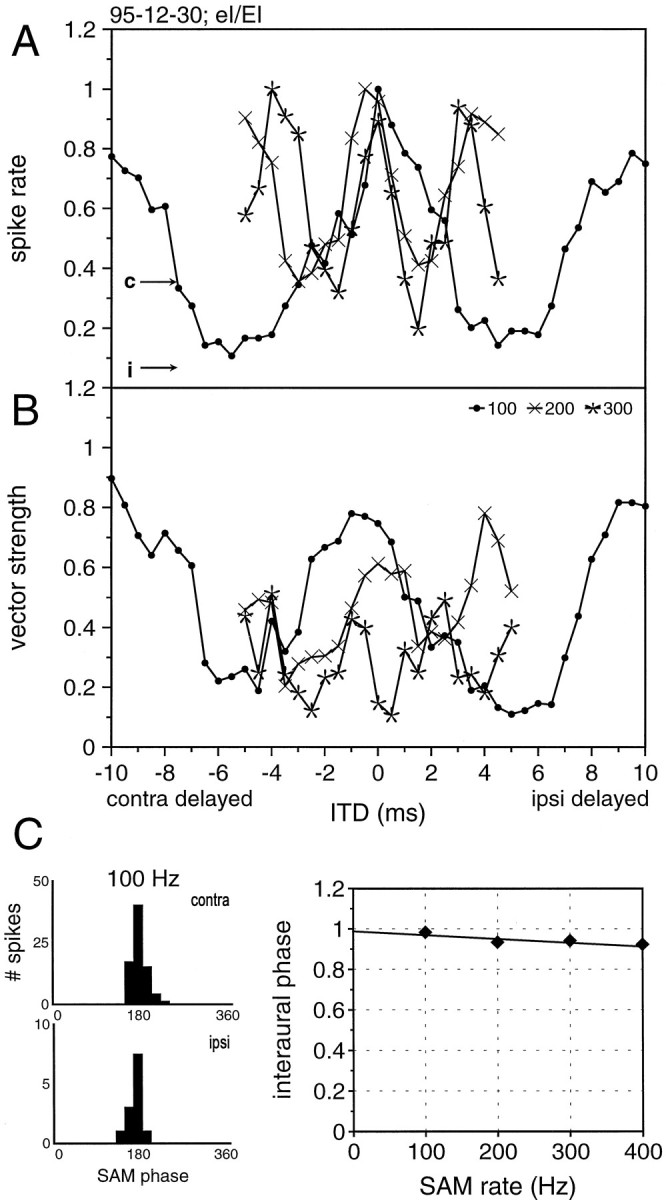
ITD sensitivity of a neuron that receives binaural excitation and inhibition in response to SAM stimuli. A, Normalized discharge rates to SAM stimuli with 100, 200, and 300 Hz modulation rates. Note that the peaks are rather stable, whereas the troughs shift as a function of the modulation frequency.B, The corresponding values of synchronization (vector strength). C, Histograms showing the monaural responses to 100 Hz SAM as a function of modulation phase (left panels) and best interaural phase diagram (right panel). The regression line indicates an EE coincidence mechanism. For details, see text.