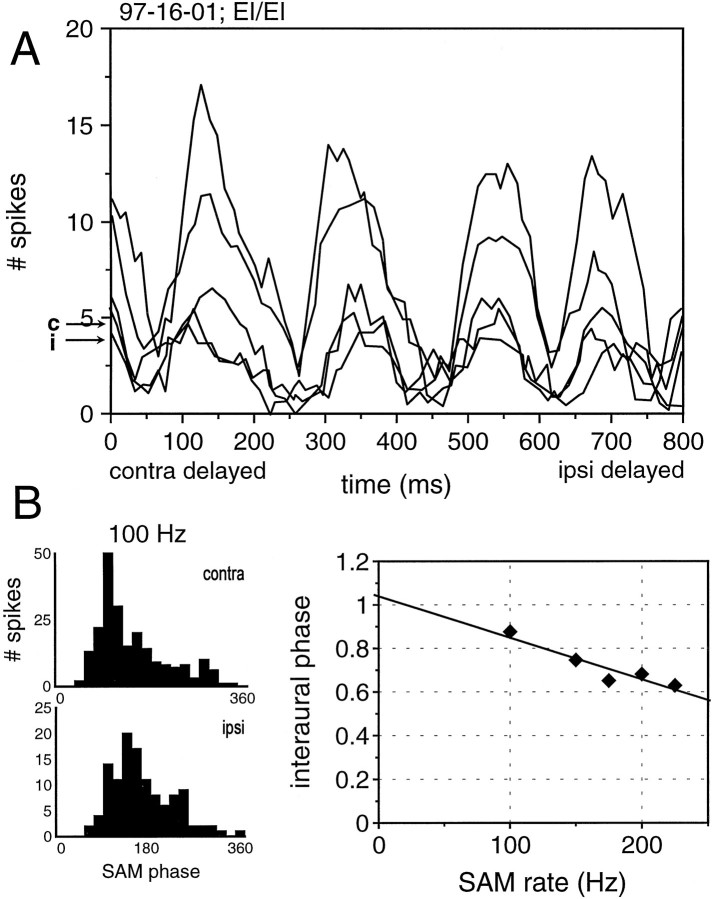
Fig. 8.
A, ITD sensitivity of a binaurally excited and binaurally inhibited neuron to binaural beat stimuli with different modulation frequencies. The function for the different SAM rates lines up because the beat frequency was 5 Hz for all tests. Hence, the interaural phase difference at a given ITD was identical for all SAM rates. B, Monaural phase histograms and interaural phase histogram indicate an EE coincidence mechanism. For details, see text.

