
Fig. 9.
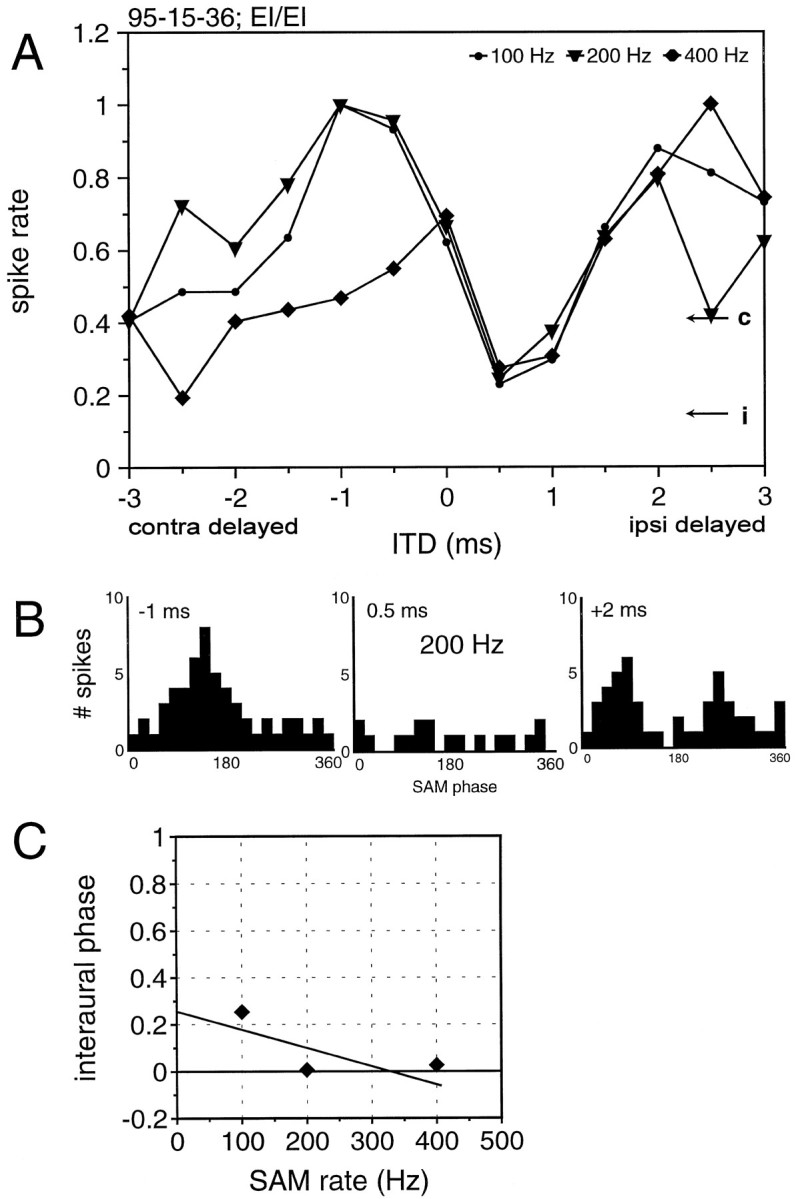
ITD sensitivity of a neuron that receives binaural excitation and binaural inhibition in response to SAM stimuli. This neuron exhibited an ITD sensitivity that differed from those described for other mammals in that the peaks did not line up. A, Normalized discharge rates to SAM stimuli with 100, 200, and 400 Hz modulation rates. B, The phase histograms for binaural responses to 200 Hz SAM exhibit one peak for an ITD of −1 msec but two peaks for +2 msec. The regression line in the interaural phase delay diagram (C) does not conform with either an EE or an EI coincidence mechanism.