
Fig. 4.
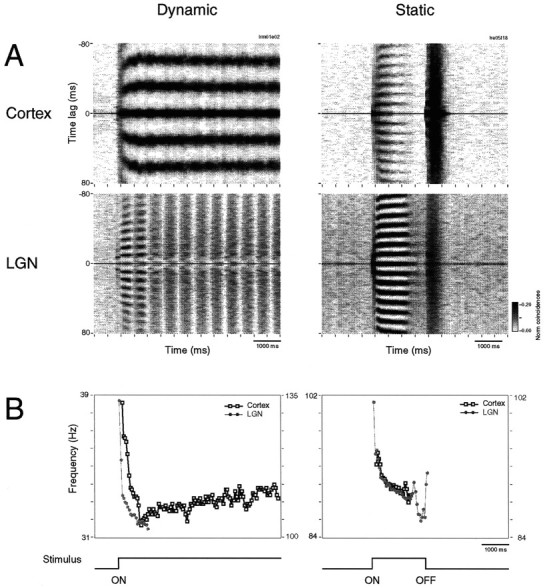
Oscillatory patterning of cortical and geniculate oscillations as a function of dynamic and static stimulation conditions. Simultaneous multi-unit recordings were obtained from left A17 and left LGN (lamina A1, dynamic condition) and from left A18 and right LGN (lamina A1, static condition). A, Sliding window autocorrelation functions computed for the two stimulus conditions (left panels, Dynamic; right panels, Static). Drifting gratings induce strong 30–60 Hz oscillations in the cortex that persist during the entire response (top left panel), and high-frequency oscillations in the LGN are limited to the initial phase of the response (bottom left panel). The flashed light stimulus induces high-frequency oscillatory responses of similar frequency in both the cortex and the LGN (top and bottom right panels), oscillatory responses being stronger for LGN than for cortical neurons. B, Absolute change of oscillation frequency after response onset (■, cortex; •, LGN). In theleft panel, two different Y-scales were used (cortical oscillation frequency, left; LGN,right). Time course of the stimulus is indicatedbelow the panels. Calibration, 1000 msec. Sliding correlation analysis window, 200 msec; step, 50 msec.