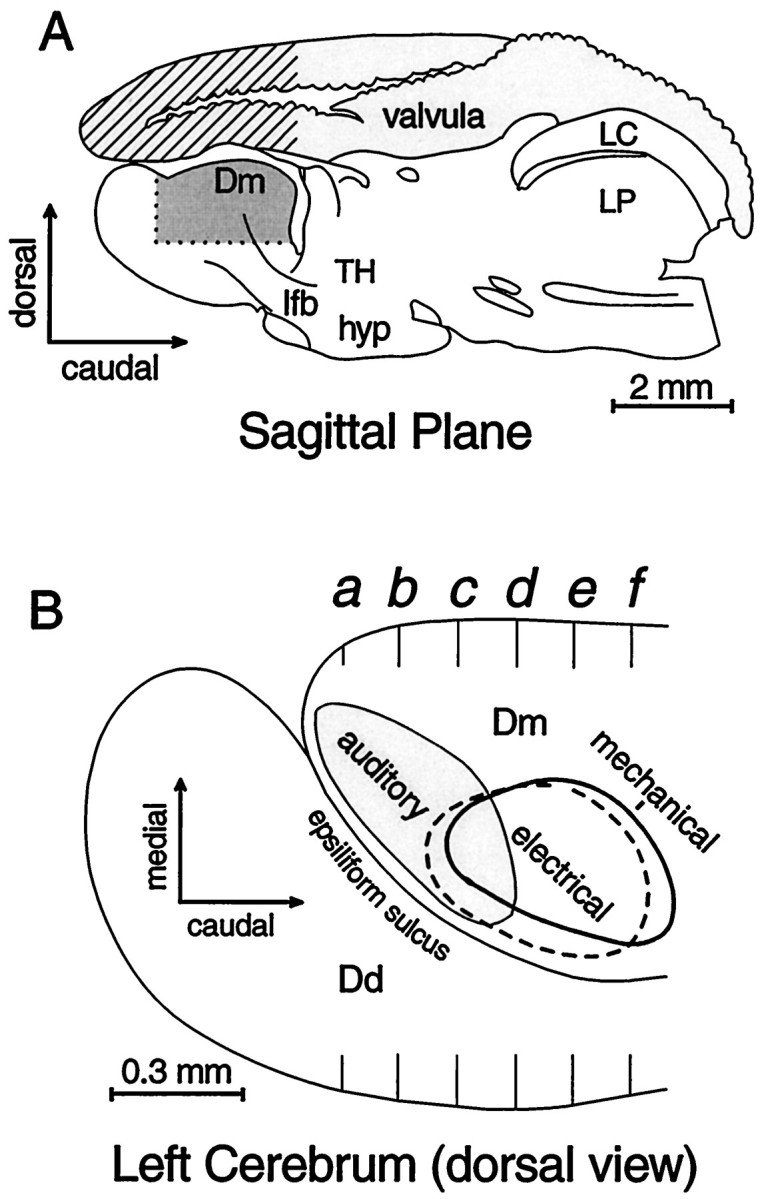
Fig. 1.

Diagrams of gross anatomy of theGnathonemus brain and the area sampled.A, Cross-hatched area indicates the segment of valvula that was removed on one side for most experiments. Dark shading approximates the area in which most recordings were made. B, Dorsal view of the cerebrum, as though transparent, that summarizes the horizontal distribution of unimodal octavolateral sensory responses. Center of mechanosensory response zone (thick line) lies ∼400 μm ventral to the center of electrosensory area, which is ∼300 μm deep to the dorsal surface with almost no overlap (dashed line). Auditory zone, also 0–500 μm deep, overlaps the electric. Stars represent the diffuse distribution of visually responsive loci, 600–1700 μm below the surface. Cross-section markers a-f indicate transverse reference planes used in Figures 2 and 3. Dd, Telencephalic area dorsalis pars dorsalis; Dm, telencephalic area dorsalis pars medialis; hyp, hypothalamus;LC, caudal lobe; lfb, lateral forebrain bundle; LP, posterior lateral line lobe;TH, thalamus.
