
Fig. 3.
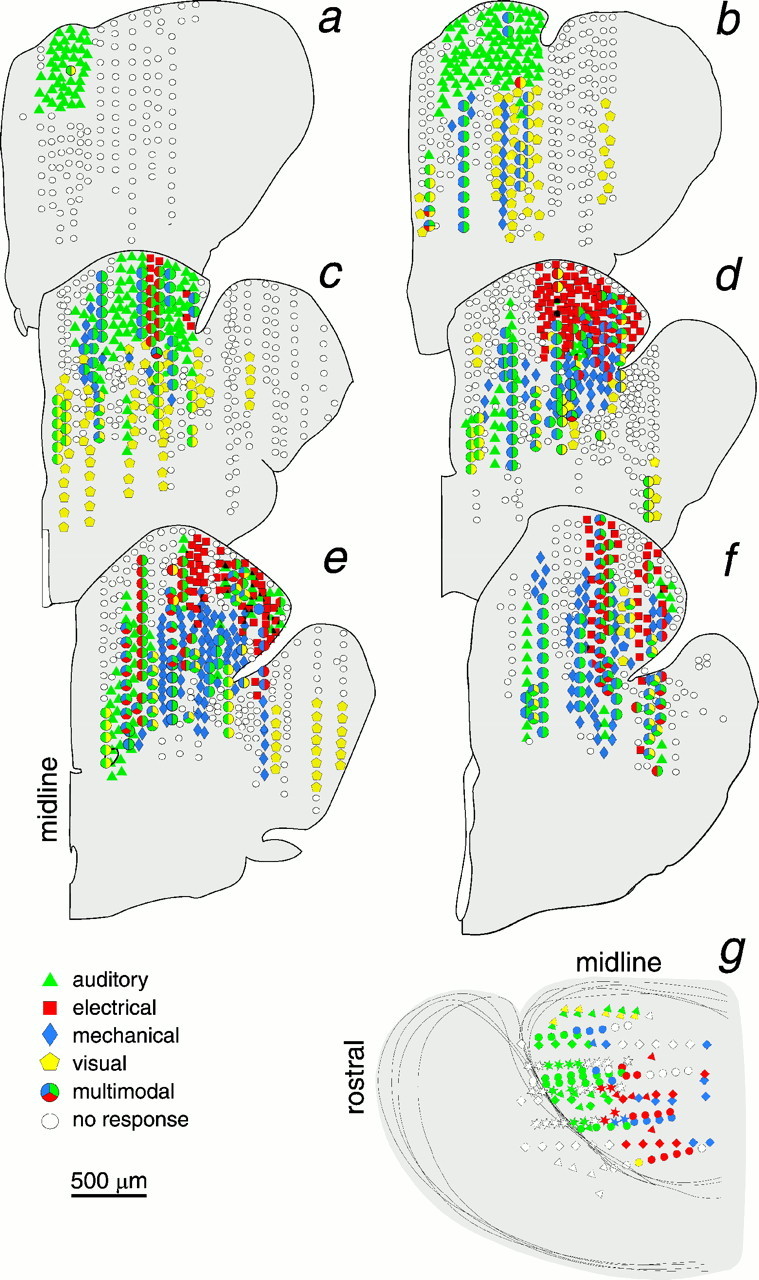
a-f, Reconstructed distribution of sensory-evoked responses, superimposing data from 18 animals, projected onto six transverse planes (half sections). Sections a-fcorrespond to the planes of the section in Figures1B and 2. Sampled depths in each penetration were usually 50 μm apart; here a small fraction of the loci recorded from are plotted. Responses to each stimulus type are color-coded, and multimodal responses are represented by larger polygons with combinations of color codes. White marks indicate a lack of response to any stimulus; their scatter among responsive loci reflects the between-animal variability in the size and location of unimodal response zones. g, Plan view of left cerebral hemisphere, as in Figure 1B, shows the superimposed unimodal response distributions from four specimens represented by four symbols (triangle,diamond, circle, and star) but with the same color code as in transverse sections. Depth of response sites is not indicated.