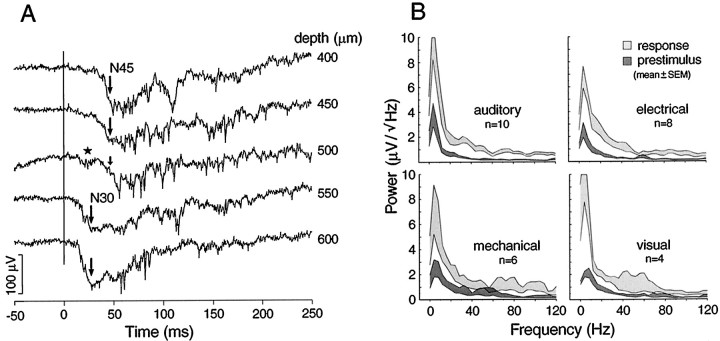
Fig. 5.
Latencies and frequency compositions of sensory-evoked potentials. A, AEP depth profile illustrating a shift of principal wave (N45) to a shorter latency (N30) below 500 μm, which is still an active depth, judging by local spikes. Large arrows indicate the peaks of principal waves. An intermediate form at 500 μm shows a loss of the N45 (small arrow) and emergence of the N30 (star). B, Amplitude spectra show the distribution of power in the different frequency bands before the stimulus and during the response. Shaded areas indicate the mean ± SEM. White areas between the shaded traces are proportional to the reliability of the power increases. Plots based on the averages of averaged responses, 10 auditory, 8 electrical, 6 mechanical, and 4 visual from different animals.

