Fig. 5.
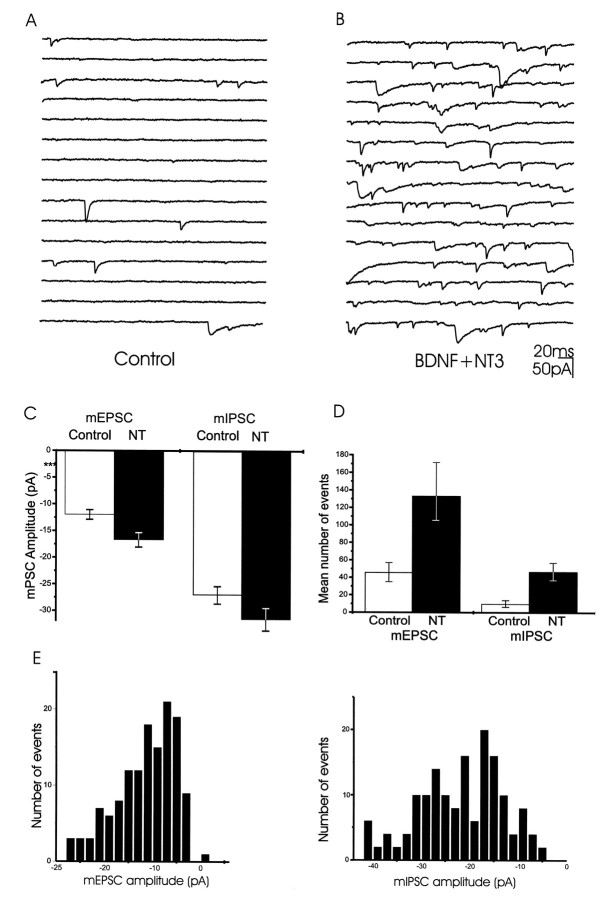
Neurotrophins enhanced the frequency of miniature synaptic events. mPSCs elicited by high osmotic stimulation in the presence of TTX were registered. Responses were recorded for 10 sec after stimulation. Excitatory events were defined as any mPSC with a decay time constant <10 msec. Inhibitory events were defined as any mPSC with a decay time constant >12 msec. A, E16 control cells present very few events after stimulation.B, The frequency of the mPSCs was markedly enhanced by BDNF plus NT-3 (NT) treatment. C, Plot of the mEPSC and mIPSC amplitudes show that neurotrophins only cause small increases in the amplitudes of the miniature events. In the neurotrophin-treated cultures, the amplitudes of mEPSCs and mIPSCs were 40% (p < 0.05) and 16% (p < 0.01) greater than in controls, respectively. The amplitudes of mEPSCs and mIPSCs in the untreated cultures were −11.9 ± 2.6 pA and −27.3 ± 3.3 pA, respectively (Fig. 5C). In the neurotrophin-treated cultures, the amplitudes of mEPSCs and mIPSCs were −16.7 ± 3.1 pA (40% above control levels; p < 0.05) and −31.6 ± 2.8 pA (16%; p < 0.01), respectively. D, Plot of the mean number of events in 10 sec in control and BDNF plus NT-3-treated cultures. Neurotrophin-treatment produced a threefold and fivefold enhancement in the number of mEPSC and mIPSC events, respectively. The frequency of mEPSCs and of mIPSCs in the untreated cultures was 46.0 ± 11 and 10.0 ± 3.9/10 sec (n = 10 cells), respectively. In the neurotrophin-treated cultures, the frequency of mEPSCs was 133.0 ± 38.0, and the frequency of mIPSCs was 48.0 ± 10.0 (n = 10 cells). E, Distribution of the frequency of mEPSCs amplitudes (left histogram) and mIPSCs amplitudes (right histogram) from BDNF plus NT-3-treated cultures.

