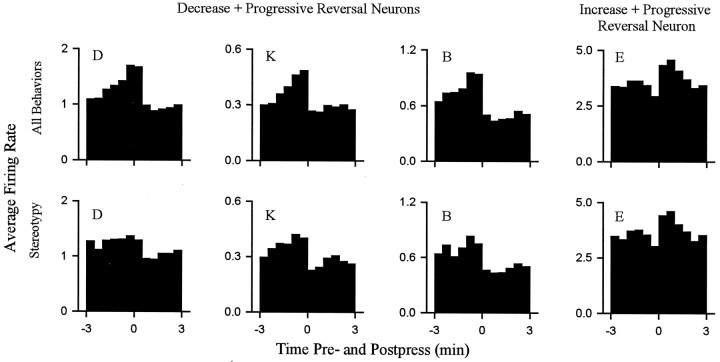
Fig. 10.
The change + progressive reversal firing pattern persisted when all locomotion was excluded from calculations of firing rate. Each histogram shows the phasic change in firing time locked to the cocaine reinforced lever press. Data are shown for four neurons. Each column corresponds to a single neuron. Thetop row displays histograms constructed by calculating firing rate during all behaviors (i.e., shows the normal change + progressive reversal firing pattern). The bottom rowshows histograms constructed by calculating firing rate during periods of only focused stereotypy. For each histogram theabscissa displays minutes before and after the press (Time 0 represents occurrence of the lever press.) Theordinate shows average firing rate (hertz).

