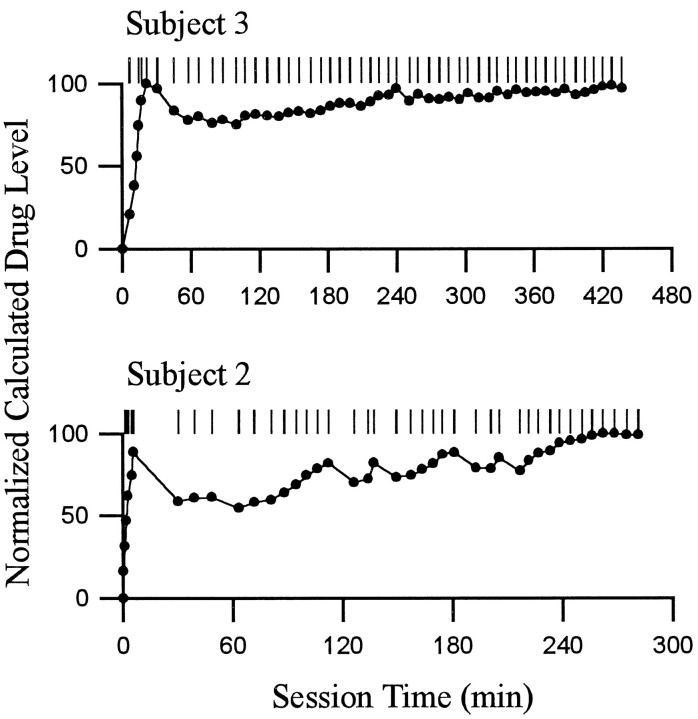
Fig. 3.
Patterns of lever presses and calculated drug level. Each of the two rows shows the self-administration behavior of a single animal during a single self-administration session. For each behavioral display, the following is shown. The abscissashows time (minutes) during the self-administration phase of the recording session; Time 0 corresponds to time of the first lever press. The pattern of reinforced lever presses is shown at the top. Each tick represents the occurrence of one cocaine reinforced lever press. Underneath the display of lever presses is a graph of the normalized calculated drug level present at the time of the self-infusion behavior (i.e., before the onset of the infusion) (c.f., Peoples et al., 1997). Calculated drug levels were normalized within each session relative to the maximum calculated drug level attained in the session. Although the calculated drug level (data not shown) may have differed from the actual drug level by some constant amount, the relative stability of the calculated drug level across the self-administration session demonstrates the degree to which the rate of self-infusion was likely to have maintained body levels of drug within stable limits (c.f., Yokel and Pickens, 1974). The patterns of behavior shown are representative of the range of regularity in self-administration behavior exhibited by subjects in the present study.

