
Fig. 2.
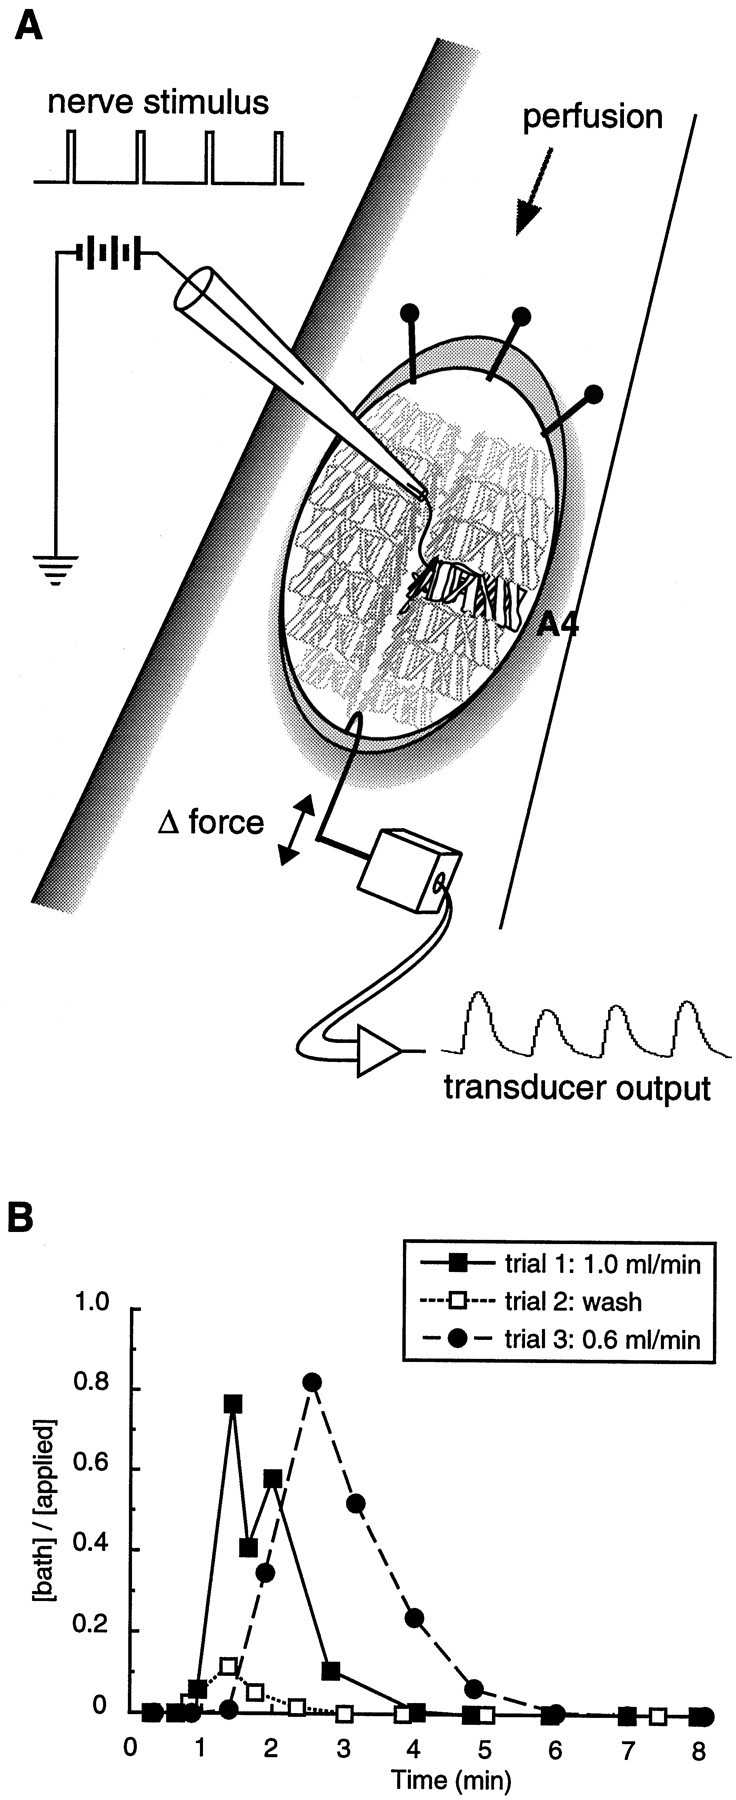
Schematic diagram of the neuromuscular preparation. A, After removal of the gut and CNS, the anterior of each larva was pinned to the recording dish while the posterior was tethered to the arm of a calibrated strain gauge. Stimulation of an abdominal nerve with a suction electrode (2–6 V, 25–35 msec, 1 Hz) elicited contractions in the muscles of one abdominal half-segment (black muscles). Occasionally, the nerve stimulus also elicited contractions in muscles of adjacent segments (nearest of the muscles shown ingray). B, Changes in the bath dye concentration/applied dye concentration as a function of time. Three successive trials were performed. In trials 1 and3, the dye (fast green) was applied to the recording chamber at time = 0 min. In trial 2, 1 ml of saline was used as a wash. The perfusion rate in trials 1 and2 (1.0 ml/min) was equal to the fastest rate used in the contraction assays. The perfusion rate in trial 3 (0.6 ml/min) was close to the slowest rate used in the assays.