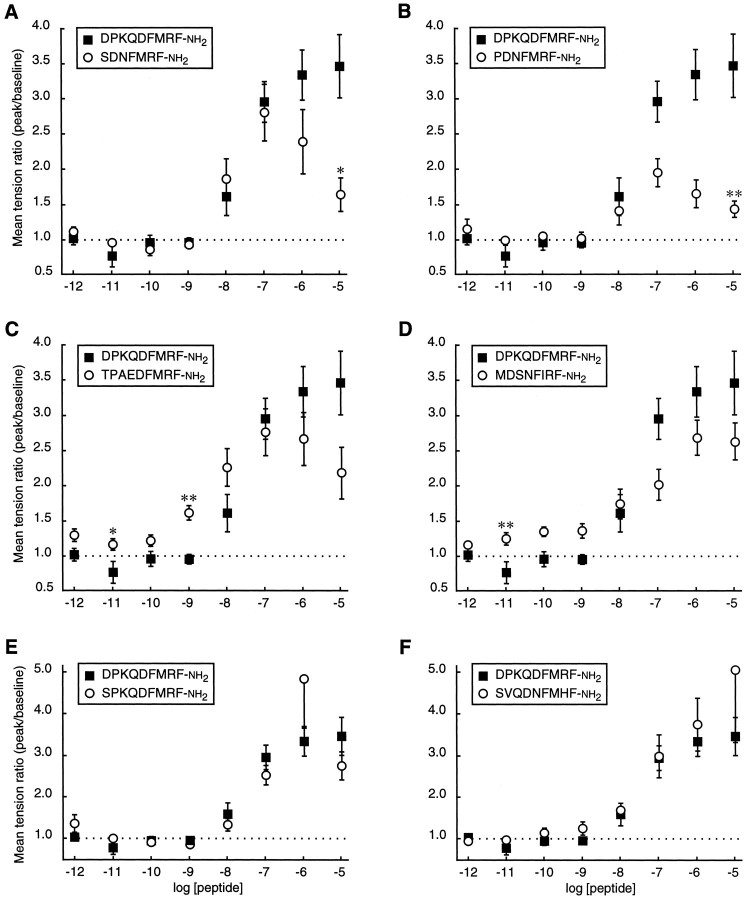
Fig. 6.
Mean tension ratio ± SEM as a function of peptide concentration for each of the predicted excitatory products of the FMRFamide gene (wandering third instar larvae). For clarity, the results were plotted in six sets, and the dose–response curve for DPKQDFMRFamide (see Fig. 3B,n = 7) was included in each set for reference. However, at each concentration a single ANOVA was performed on the complete data set, containing the results for all seven active peptides. Individual means were compared by post hoctesting subsequent to the ANOVA. *p < 0.05; **p < 0.01 (Spjotvoll–Stoline) [one-way ANOVA; 10-11m,F(6,55) = 3.164, p = 0.0097; 10-10m,F(6,55) = 4.810, p = 0.0005; 10-9m,F(6,55) = 7.896, p = 0.0001; 10-6m,F(6,55) = 3.319, p = 0.0073; 10-5m,F(6,55) = 7.353, p = 0.0001]. n = 10, SPKQDFMRFamide, SDNFMRFamide, and TPAEDFMRFamide; n ≥ 9, PDNFMRFamide;n ≥ 7, SVQDNFMHFamide; n ≥ 8, MDSNFIRFamide.

