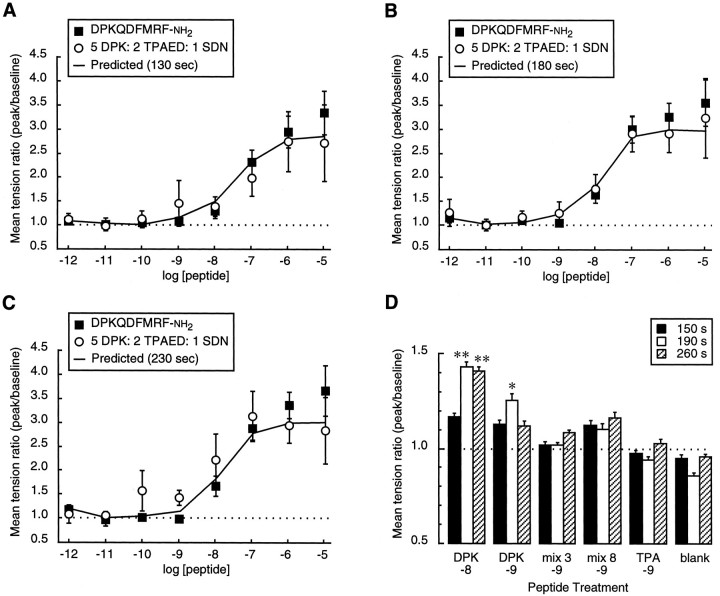
Fig. 8.
The effects of stoichiometric molar ratios of dFMRFamide-related peptides are additive. A–C, Mean tension ratio ± SEM is shown as a function of total peptide concentration, using a peptide mixture (“mix 3”) containing DPKQDFMRFamide, TPAEDFMRFamide, and SDNFMRFamide in a 5:2:1 molar ratio (“mix 3,” n = 10; DPKQDFMRFamide,n = 7). The predicted curve (solid line) was generated by averaging the results for DPKQDFMRFamide, TPAEDFMRFamide, and SDNFMRFamide in the same 5:2:1 ratio (data from the same recordings as in Fig. 6). Peak twitch tension measurements for “mix 3,” DPKQDFMRFamide, and the predicted curve were taken at 130 sec (A), 180 sec (B), or 230 sec (C) after the onset of peptide application. D, Mean tension ratio ± SEM measured at 150, 190, and 260 sec after the onset of peptide application. The six treatments were used in a double-blind experiment in a randomized order (n = 14 for all treatments). The differences in tension measured at 150, 190, and 260 sec with the blank control were not statistically significant (one-way ANOVA). DPK −8, 10-8mDPKQDFMRFamide; DPK −9, 10-9m DPKQDFMRFamide; mix 3 −9, 10-9m, 3 peptide mix in 5:2:1 ratio;mix 8 −9, 10-9m, 8 peptide mix in 5:2:1:1:1:1:1:1 ratio; TPA −9, 10-9m TPAEDFMRFamide;blank, saline control. *p < 0.05; **p < 0.01 (Spjotvoll–Stoline) [data inD, one-way ANOVA: 190 sec,F(5,78) = 5.091, p = 0.0004; 260 sec, F(5,78) = 3.637,p = 0.0052].

