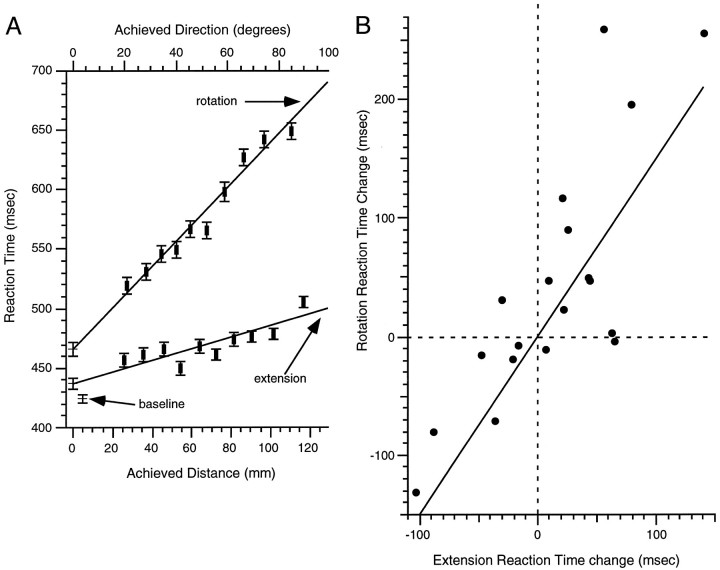
Fig. 4.
Reaction time for the constrained tasks.A, Mean normalized RT and mean achieved direction (or distance) for each of 10 “equally sized” bins of achieved direction (or distance) in the constrained rotation (or extension) task. Each fitted line corresponds to the regression through weighted raw data of the constrained rotation (or extension) task (see Materials and Methods). The estimated intercepts (at 0 mm for extension and 0° for rotation), as well as the mean RT for the constrained baseline task, are also illustrated. Data binning here and in other figures is used solely for illustrative convenience. All analyses were done with raw data (see Materials and Methods). B, Correlation between RT in the rotation and extension tasks. Additional details are in text.

