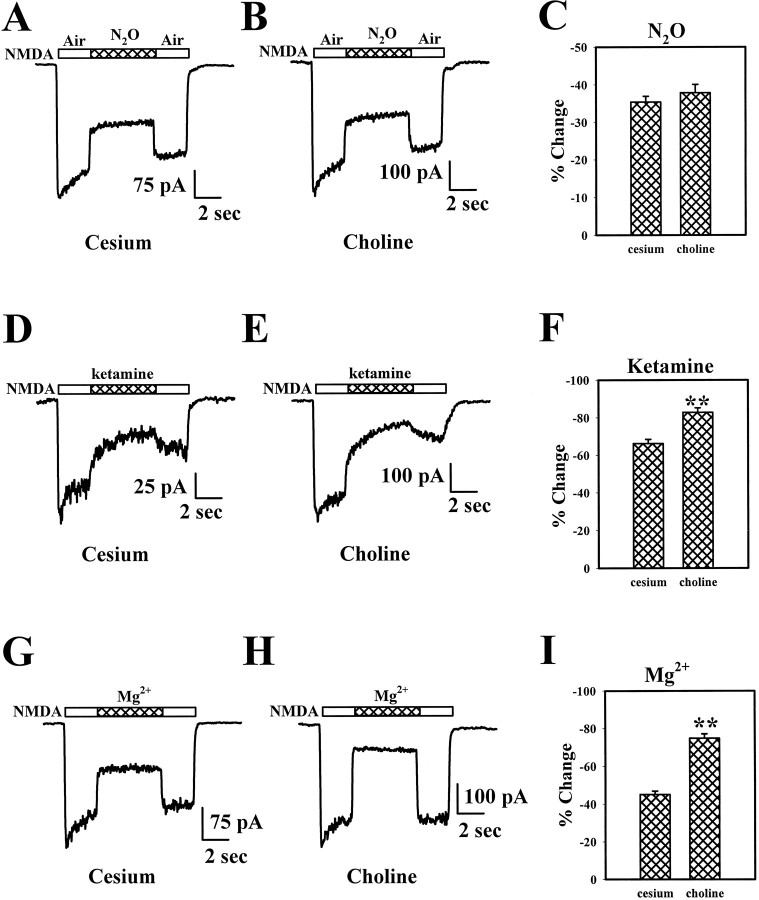
Fig. 4.
Effect of changing the reversal potential of the NMDAR current on blockade of NMDAR responses. A,B, Raw traces from two different cells illustrate the N2O block with cesium loading (A) and choline loading (B). The horizontal bars over thetraces indicate the timing of drug applications.C, At a holding potential of −30 mV, the degree of N2O block in cesium-loaded cells was not significantly different from the degree of block in cells loaded with choline (p > 0.3, unpaired t test;n = 14 cesium- and 11 choline-loaded cells). Choline loading changed the reversal potential of currents from ∼0 to approximately +50 mV. D, E, Rawtraces from two different cells illustrate the ketamine block in cesium- versus choline-filled cells. F, At a holding potential of −30 mV, the degree of ketamine (5 μm) block in choline-loaded cells was significantly greater than the block in cesium-loaded cells (p < 0.001, unpairedt test; n = 7 cesium- and 6 choline-loaded cells). G–I, A protocol similar to that shown in A–C and D–F was used except that Mg2+ was used as the antagonist and the holding potential was −60 mV. Raw traces in allpanels have been filtered at 10 Hz for display.

