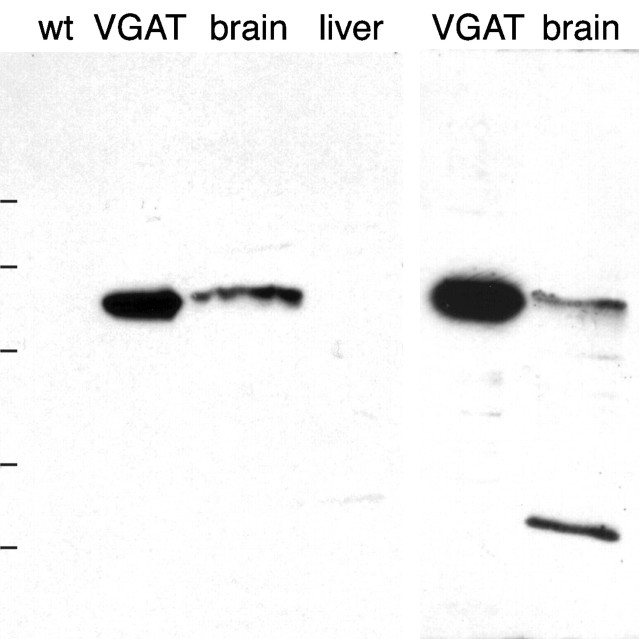
Fig. 1.
Specificity of antibodies to VGAT as demonstrated by immunoblotting after electrophoretic (SDS-PAGE) separation of proteins. Left, N2 antibody. Right, C1 antibody. Extracts of brain and VGAT-expressing PC12 cells (VGAT) show bands with a similar molecular mass (∼57 kDa). The bands are absent in liver and wild-type PC12 cells (wt). Positions of molecular mass standards are indicated on the left (83, 62, 47.5, 32.5, and 25 kDa, consecutively from the top).

