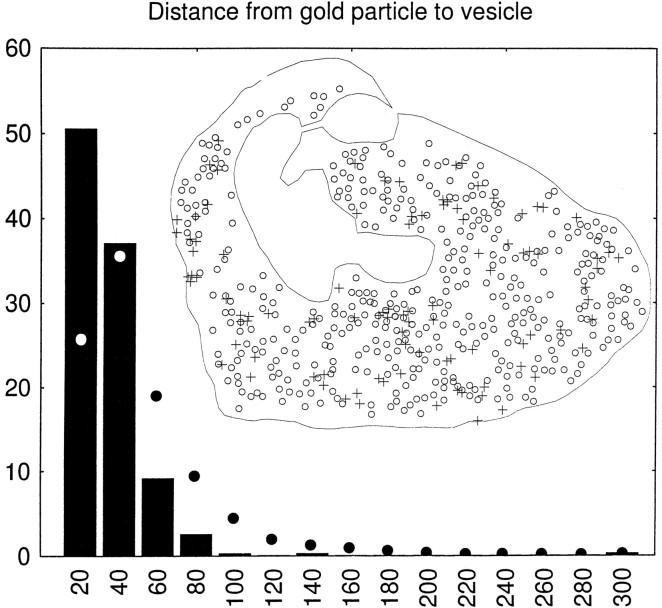
Fig. 12.
Quantification of the association of VGAT with synaptic vesicles (GABAergic basket cell terminals in the cerebellar cortex). Inset, Illustration of the recording of data, exemplified by the terminal shown as an electron micrograph in Figure11D; the center of each gold particle (+) and of each identifiable synaptic vesicle (○) is digitized, as well as the outline of the terminal, excluding mitochondria and (in other terminals) areas occupied by filaments (compare Fig.11B,C). Columns, Intercenter distances between each gold particle (394 particles in 12 terminals) and the nearest synaptic vesicle sorted into bins of 20 nm, they-axis showing percent of total in each bin (columns). Filled circles, Distances to the vesicle centers from points (1000 per terminal) randomly distributed over the parts of the terminals accessible to synaptic vesicles (see inset). The two distributions were statistically significantly different (p = 0.0005, continuity corrected χ2 test).

