
Fig. 2.
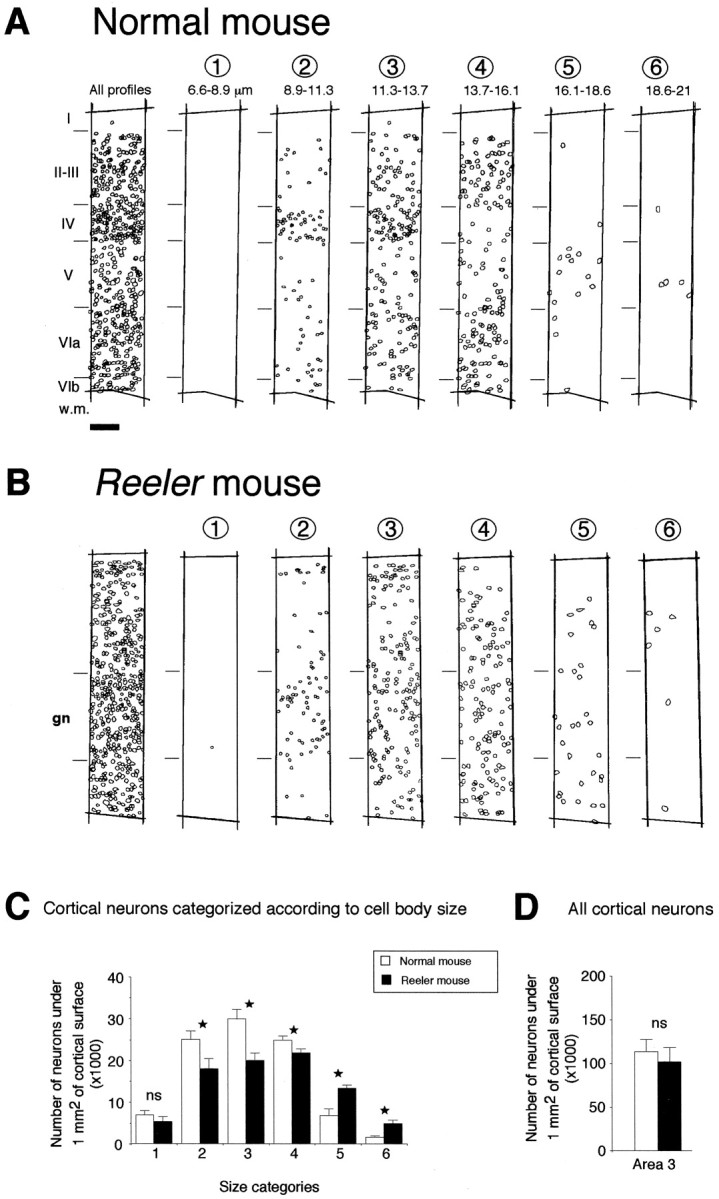
Cytoarchitectonic analysis of the normal andreeler mouse neocortex. Cell bodies were stained using cresyl violet, and all identifiable neuronal profiles encountered in a radial strip of primary somatosensory cortex were drawn.A, Normal mouse; B, reelermouse. All neuronal profiles are shown in the far left panel. The following six panels show the radial distribution of neurons showing different categories of diameters. C, Histograms representing the mean number of neurons for each category encountered under 1 mm2 of cortical surface in parietal area 3; D, total mean number of neurons encountered under 1 mm2 of cortical surface. Data were collected from seven normal and seven reeler mice. In all cases, error bars indicate 1 SD. Statistical analysis: *p < 0.05; ns, not statistically significant according to a Mann–Whitney U test.gn, Region where granular neurons are encountered in thereeler cortex. Scale bar (shown in A forA, B): 45 μm.