Fig. 3.
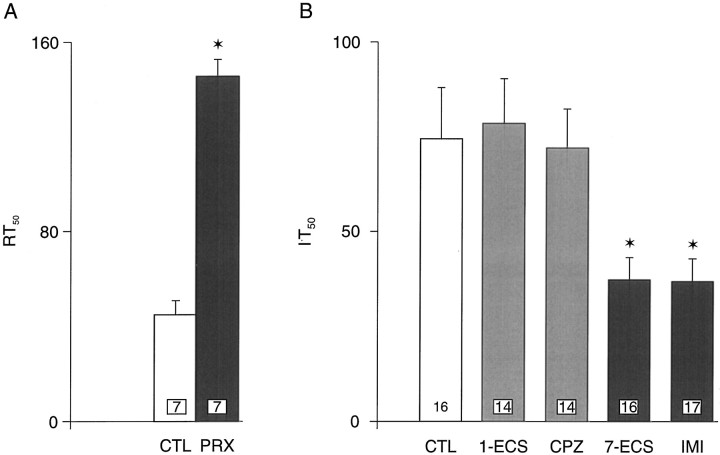
A, Recovery time, expressed asRT50 values (means ± SEM), of dorsal hippocampus CA3 pyramidal neurons from the microiontophoretic application of 5-HT in control rats and rats treated with paroxetine for 21 d (10 mg · kg−1 · d−1, s.c.). The numbers in the columns indicate the number of rats tested. *p < 0.05 (unpaired Student’st test). B, Mean (± SEM)I·T50 values (see Materials and Methods) in control (CTL) and rats treated with one ECS (1-ECS), seven ECSs (7-ECS), chlorpromazine (CPZ), and imipramine (IMI). The numbers in the columns indicate the number of neurons tested. *p < 0.05 (unpaired Student’s t test).

