
Fig. 4.
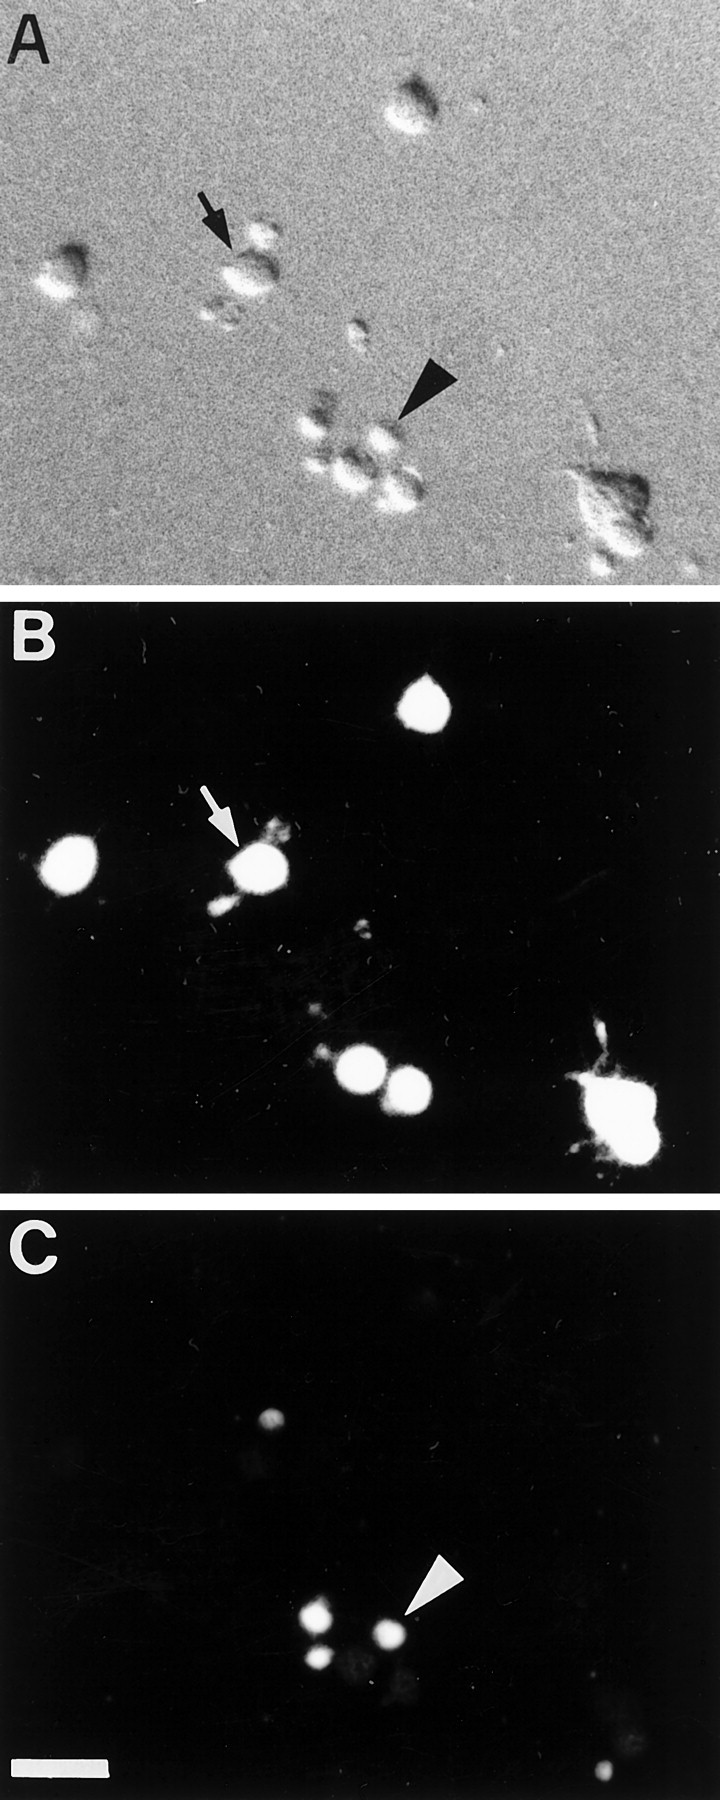
PR stained by the Live/Dead assay.A, Nomarski image; live (B) and dead (C) cells and nuclei within the same microscopic field. “Live” (arrow) and “dead” (arrowhead) cell labeling was mutually exclusive. Scale bar, 10 μm.
Official websites use .gov
A
.gov website belongs to an official
government organization in the United States.
Secure .gov websites use HTTPS
A lock (
) or https:// means you've safely
connected to the .gov website. Share sensitive
information only on official, secure websites.
PR stained by the Live/Dead assay.A, Nomarski image; live (B) and dead (C) cells and nuclei within the same microscopic field. “Live” (arrow) and “dead” (arrowhead) cell labeling was mutually exclusive. Scale bar, 10 μm.