
Fig. 9.
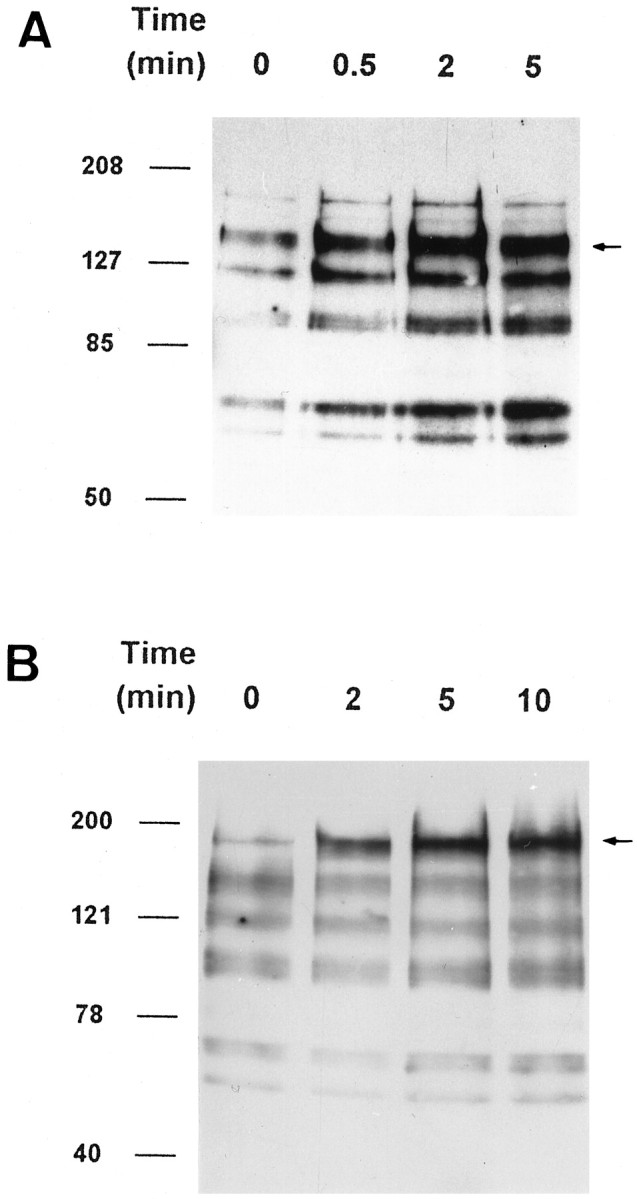
FGFR and EGFR phosphorylation in PR cultures. Representative immunoblots using anti-phosphotyrosine antibody of PR either nonstimulated (0) or stimulated for 0.5, 2, and 5 min with FGF-2 (100 ng/ml after 3 d in vitro) (A) or 2, 5, and 10 min with EGF (100 ng/ml after 24 hr in vitro) (B). FGF-2 addition led to time-dependent phosphorylation of the putative FGFR (140 kDa, arrow), as well as four other lower molecular mass bands. FGFR tyrosine phosphorylation was maximal by 2 min, whereas maximal phosphorylation of second messenger proteins lagged behind (A). Notice the increasing phosphorylation of a single band corresponding to the putative EGFRs, saturating at 5 min (B, arrow). See Results for additional details.