Fig. 10.

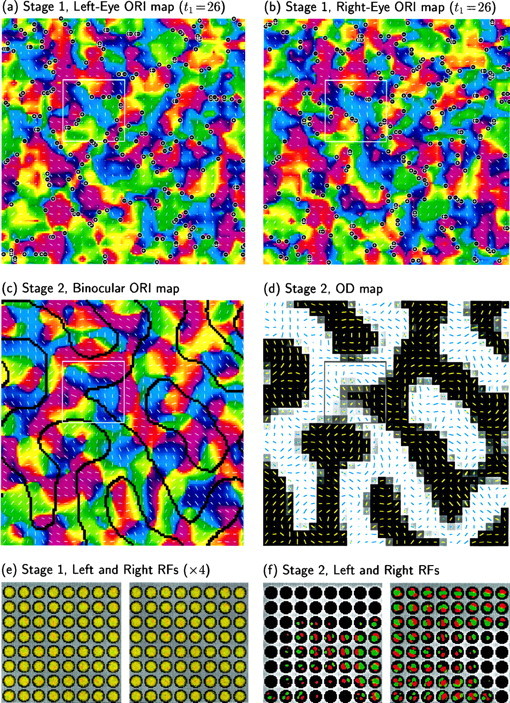
Development of ORI and OD in a two-stage scenario. a, b, The first stage begins from random synaptic connections and develops under LGN correlation functions as in Figure 6a,b: CORI+ = M (Fig. 1c) and is the only non-zero composite correlation function. Weak ORI maps have developed, with little variation in OD, by t1 = 26 with learning rate η = 0.008. c, d, The second stage continues from the synaptic weights in a and b, using correlation functions as in Figure8 with γ = 3 and d = 2 (λOD/λORI+ = 1.9): COD is now a broad Gaussian, whereas CORI+ = M is unchanged. (A range of d values would give similar results; see Fig. 11.) c, ORI preference map at the end of the second stage. Along with map refinement, average ORI selectivity Q has increased from 0.069 (a, b) to 0.122 (c). Preferred ORI changes smoothly across OD boundaries, shown as black lines.d, OD map after the second stage. Preferred ORIs measured through the left and right eyes are shown as yellow andblue lines, respectively. e, f, Left- and right-eye RFs of the 8 × 8 subset of neurons outlined in a–d. Color scheme as in Figure 5b, with weights in e multiplied by 4 for visibility.
