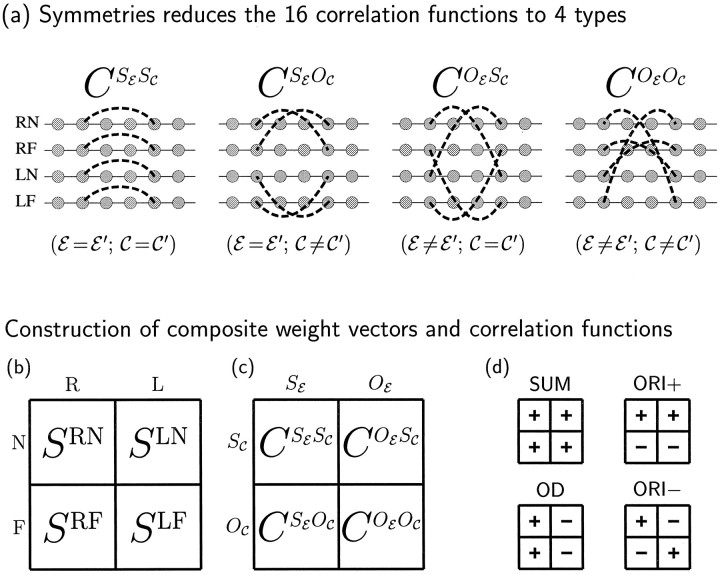
Fig. 2.
a, If we assume the left and right eyes may be treated equivalently, and likewise for the ON and OFF cells, then the 16 correlation functions CEC,E′C′, E, E′ ∈ {R, L}, C, C′ ∈ {N, F}, reduce to only four distinct functions CXY, as shown. Here X ∈ {SE, OE}, where SE means same eye and OE means opposite eye; and Y ∈ {SC, OC}, where SC means same center type and OC means opposite center type. b–d, Development is most easily described in terms of four composite synaptic weights or modes, Sμ, and four corresponding composite correlation functions, Cμ, μ ∈ {SUM, OD, ORI+, ORI−}. b, On the left, the four synaptic weight variables SEC are shown in a square grid with columns labeled by eye, E, and center type, C. c, Similarly, the four correlation functions of a are also arranged in a square grid. d, To the right, there is one small grid for each μ. The symbols inside the grids define both Sμ and Cμ as sums of positively and negatively weighted entries in the corresponding positions in the larger grids to the left. For example, SOD ≡ SRN + SRF− SLN − SLF, and CORI+ = CSESC − CSEOC + COESC − COEOC. Explicit definitions are in Table 1.

