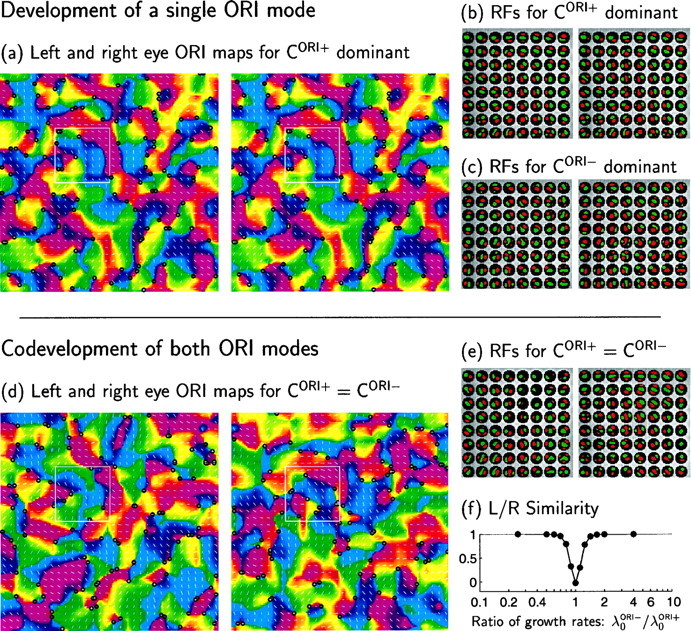
Fig. 6.

Interaction of CORI+and CORI− determines the ocular matching of orientation maps. Here both functions are set proportional to a Mexican-hat function, CORI+ = r+M and CORI− = r−M (Fig. 1c), whereas COD = CSUM= 0 (Fig. 3a). The maps and RFs that develop depend on the relative values of r+ and r−. a, b, For CORI+ dominant ( r+ = 1, r− = 0), left- and right-eye RFs and ORI preference maps are virtually identical. a, Maps show preferred ORIs and ORI selectivities (represented by orientations and lengths, respectively, of line segments) of model cortical cells in the 32 × 32 periodic array. The longest line corresponds to an ORI selectivity Q (Eq. 13) of 0.20; mean selectivity is 0.11. Line lengths in all later ORI maps are normalized on the same scale. Preferred ORIs are also represented by hue, on a finer grid (128 × 128), with intermediate pixel ORIs determined by linear interpolation. Positive and negative singularities in the (interpolated) ORI maps are indicated by black circles. b, Left- and right-eye RFs of the 8 × 8 subset of cortical cells indicated by theboxes in a. c, RFs from maps qualitatively like those of a, but developed with CORI− dominant ( r+ = 0, r− = 1). The left- and right-eye RFs have antiphase ON and OFF subregions but otherwise have virtually identical RFs and orientation maps (maps not shown, but see f). (Note that the RFs of b and c, are unrelated, because initial conditions of SORI+ and SORI− are each random and uncorrelated with one another.) d, e, When r+ and r−are of similar magnitude, the right and left eyes’ RFs develop independently. d, The independent left- and right-eye ORI maps for r+ = r− = 1. e, Independent left- and right-eye RFs from simulation in d. f, Correlation (see Materials and Methods) between left- and right-eye responses to oriented stimuli as a function of λ0ORI−/λ0ORI+, the ratio of growth rates of SORI+ and SORI− (which here is equal to r−/r+). Responses, and thus orientation maps, are essentially identical (correlation of 1) for λ0ORI− < (2/3)λ0ORI+ or λ0ORI+ < (2/3)λ0ORI−. The correlation is slightly negative for λ0ORI+ = λ0ORI− because of spatial variation in overall strength of left and right connections: constraint on summed weight received by a cortical cell ensures that, on cells in which one eye has larger than average overall weight, the other eye has less than average.
