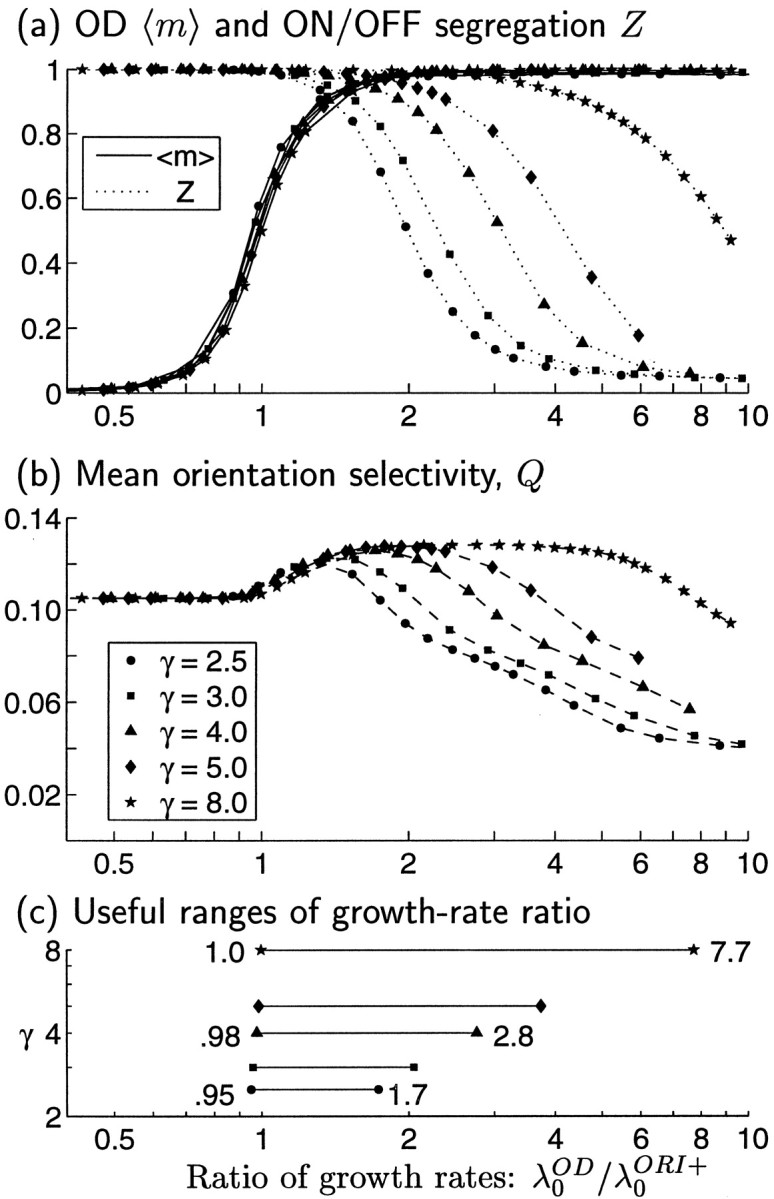
Fig. 8.

Quantitative measures of map properties for joint development of ORI and OD maps using correlation functions as in Figure7, except that we now also allow the width of COD to vary, proportional to the parameter γ (indicated by symbols). The growth rate ratio λ0OD/λ0ORI+ is varied by varying d. a, Solid curves, 〈m〉, the degree of OD segregation (see Eq. 11); dotted curves, Z, the degree of RF segregation of ON and OFF subregions (Eq. 12). b, Mean ORI selectivity, Q (Eq. 13). Higher values of λ0OD/λ0ORI+ favor development of OD, whereas lower values favor ON/OFF segregation and development of ORI selectivity. In all cases, ORI selectivities and maps are matched in the two eyes (because λ0ORI− = CORI− = 0; see Fig. 6f). c, The range of ratios λ0OD/λ0ORI+ that allows co-development of OD and ORI selectivity grows wider with increasing width, γ, of COD. We define the lower bound on the range of ratios as the value at which OD segregation 〈m〉 > 0.5 (from a) and the upper bound as the value at which ORI selectivity Q (from b) falls below the value it would have for λ0OD/λ0ORI+ = 0, i.e., for development with COD = 0. The growth rates (computed numerically) are given by: λ0OD = 14.04 d, 12.46d, 9.74d, 7.62d, and 3.94d for γ = 2.5, 3, 4, 5, and 8, respectively; λ0ORI+ = 12.84.
