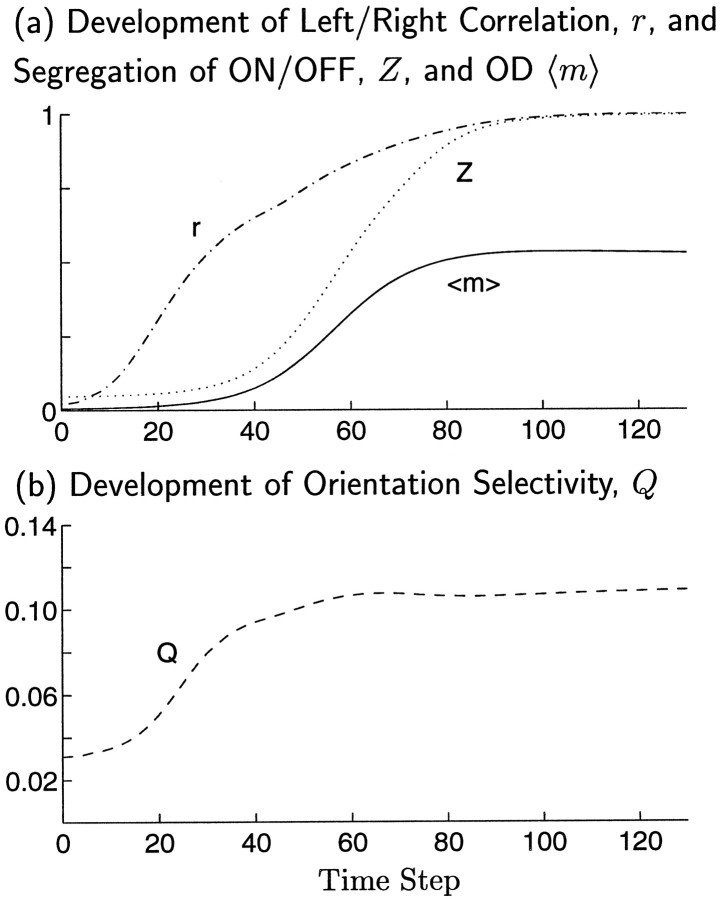
Fig. 9.
Emergence of map properties during a single simulation of joint ORI and OD map development. Correlation functions were as in Figure 7a,d. For these parameters, the fastest growing patterns of ORI and OD have nearly the same growth rate, λ0OD/λ0ORI+ = 0.97. a, Development of OD segregation, 〈m〉, ON/OFF segregation, Z, and the correlation, Pearson’s r, between the ORI map at any time step and the ORI map that will be reached at the final time step. Pearson’s r is computed from summed left- and right-eye responses to sinusoidal gratings, averaged over 18 orientations. b, Development of ORI selectivity, Q, occurs earlier than the development of either OD segregation, 〈m〉, or ON/OFF segregation, Z. High ORI selectivity is achieved by t ≈ 40, although ON/OFF segregation is low at this point. Even at this early time, the ORI map structure is already well correlated, r ≈ 65%, with its final structure. Learning rate is η = 0.008.

