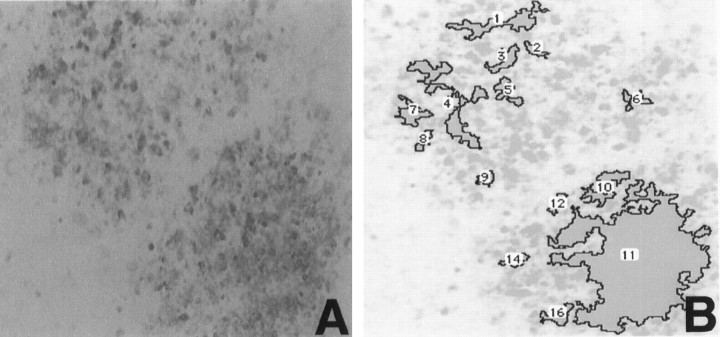
Fig. 2.
Demonstration of an image analysis of Aβir deposits in a hippocampal slice. A, 10G4 staining of deposits in a slice treated with Aβ. B, The same region after processing with NIH Image software to analyze Aβ deposits. The deposits are outlined by the program andnumbered for quantitation. Magnification is 10×.

