
Fig. 3.
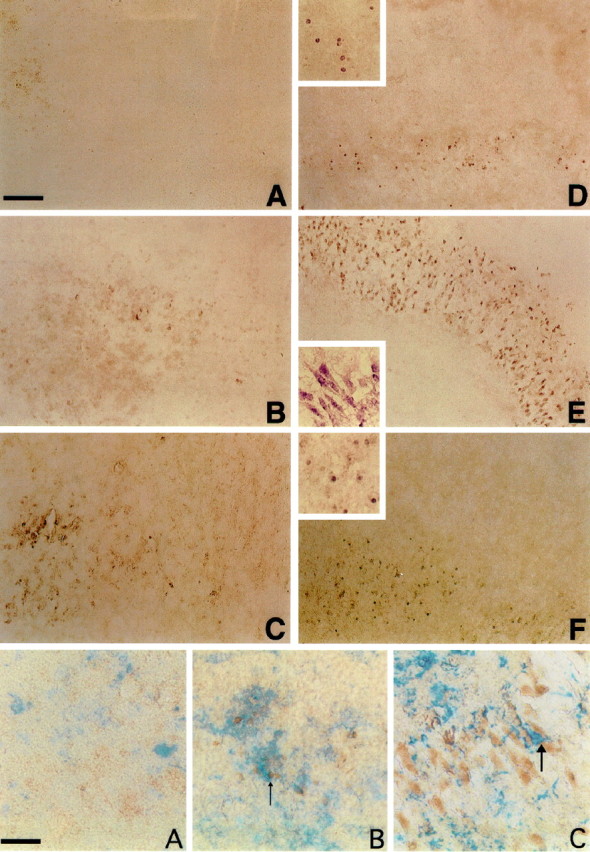
Aβir (detected by using the 10G4 antibody;brown) in the hippocampal slice culture.A, Control. B, Aβ. C, Rev Aβ. D, TGF-β1 plus Aβ. E, TGF-β2 plus Aβ. F, TGF-β3 plus Aβ. Note the pyramidal neuron staining when TGF-β2 is added with Aβ. TGF-β1 and TGF-β3 give a predominantly microglial cellular staining pattern. Large photographs are 10× magnification. Insets are 20× magnification and are taken from a region in the larger photographs. Scale bar, 40 μm.