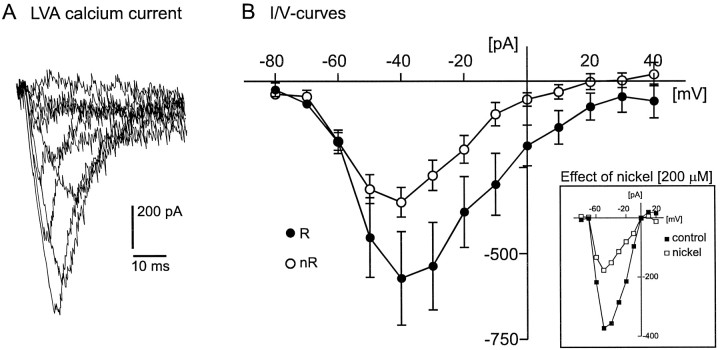
Fig. 6.
A, Example for LVA calcium current response traces (for protocol description, see Results).B, Comparison of the LVA peak current amplitude (current–voltage relationship curves) between rhythmic (R, filled circles; n = 12) and nonrhythmic (nR, open circles; n = 9) VRG neurons. Inset, Example (I–V curves) for a nickel-induced (200 μm) reduction of the LVA current amplitude (see Results).

