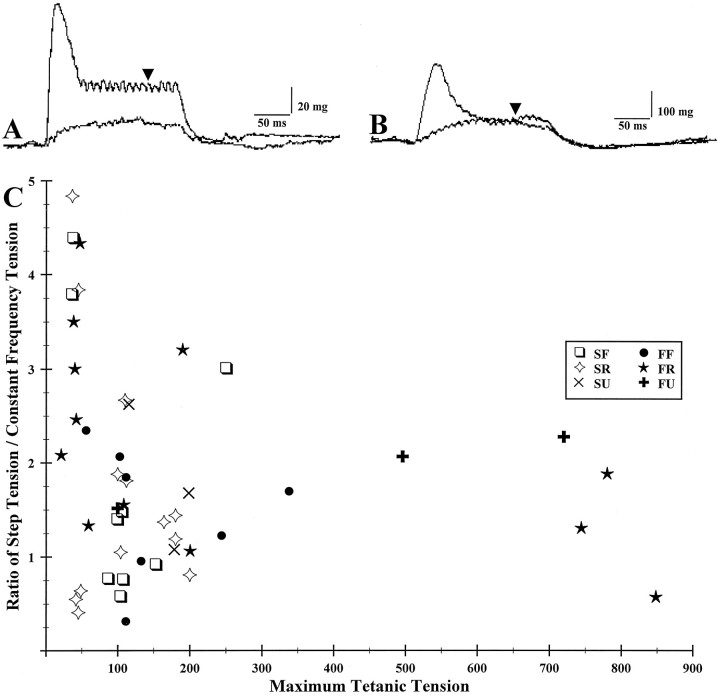
Fig. 5.
Muscle unit tetanic responses in a weak (A) and a powerful (B) unit. A, 100 Hz constant frequency compared with 100 Hz step after 500/250 Hz pulse starting at similar baselines.B, One hundred Hertz constant frequency compared with 100 Hz step after 500/250 Hz pulse starting at similar baselines.Arrows in A and B indicate the points at which tensions were compared. C, Maximum tetanic tension plotted against the ratio of step tension to constant frequency tension. Note that the weaker units tend to have higher ratios (greater hysteresis).

