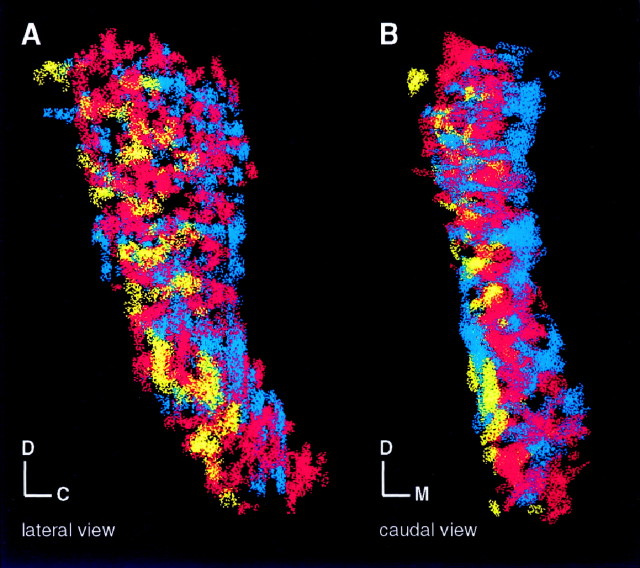
Fig. 10.
Reconstructions from the three individual cases (high-, middle-, and low-frequency cases; Fig. 9) superimposed in the same model. Yellow dots represent the distribution of labeling in the high-frequency case, red dots the middle-frequency case, and blue dots the low-frequency case. The angles of view are the same as in Figure 9. In the caudal view (B) a gradual transition from lateral (yellow) toward central (red) and medial (blue) is observed. In several places, a complementary shape of the individual clusters is seen. For example, in the dorsal third, the elongated band-like clusters of the low-frequency case (blue) fit the holes of the more continuous pattern of labeling in the middle-frequency case (red). The clusters of the low-frequency case (blue) are mostly located laterally but partly embrace and penetrate the regions occupied by labeling of the other frequencies. C, Caudal;D, dorsal; M, medial; R, rostral.

