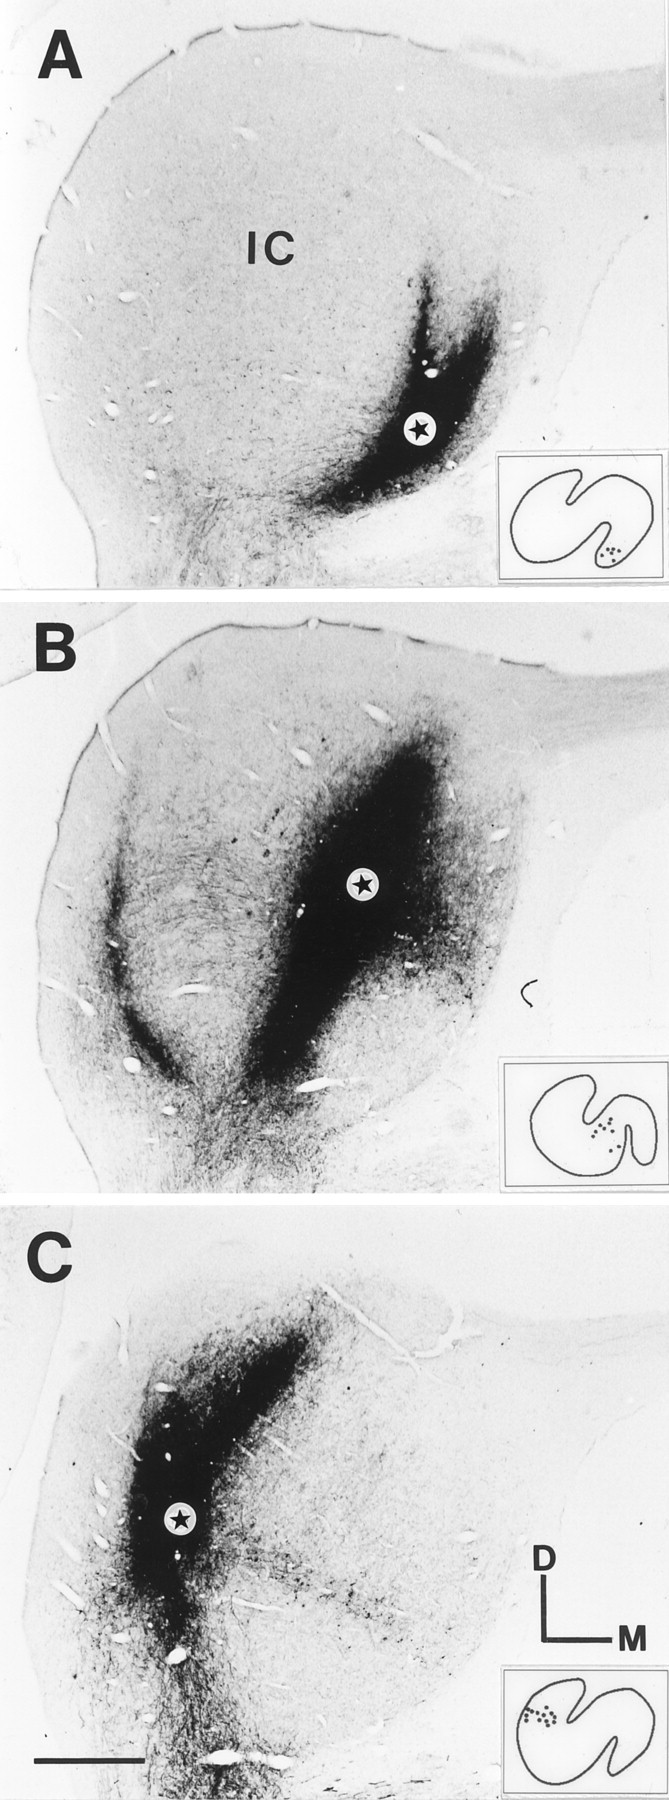
Fig. 3.

Photomicrographs of transverse sections through the center of the BDA injection sites in the left IC of the three cats used in Figures 4-12. Stars show the location of the tip of the injection electrode. Insets, Distribution of retrogradely labeled cells in a representative section through the lateral superior olive. The injections cover the high-frequency region (A), middle-frequency region (B), and low-frequency region (C). The estimated ranges of frequency representations covered by the injections are given in Table 1. Some of the staining represents labeling of the local fiber plexus in the IC (Malmierca et al., 1995). Scale bar, 1 mm.
