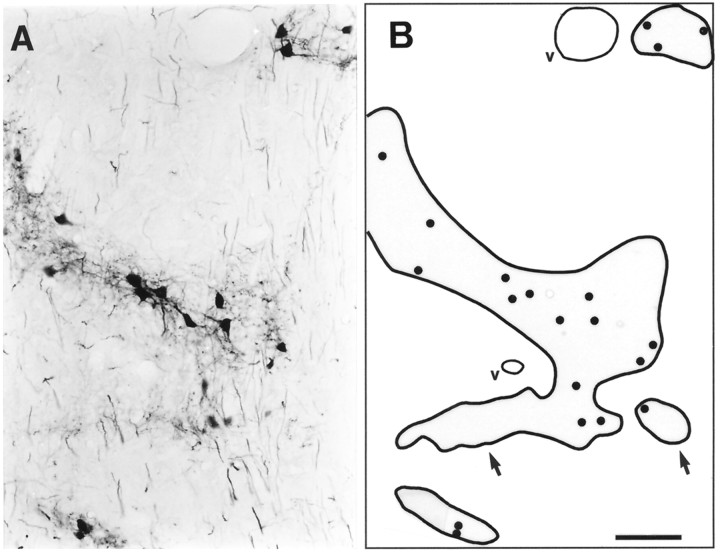
Fig. 4.
A, Photomicrograph showing patches of labeling in the VCLL after BDA injections into the ipsilateral IC (same case as shown in Fig. 5). B, Camera lucida drawing of the same region showing the location of the labeled cell somata (points), the patch borders (thick contour lines), and blood vessels (thin contour lines, v). The user focused through the thickness of the specimen to draw the patch border at the maximum extent of labeling. This explains the small deviations between the patch borders in the photomicrograph (A) and the contour lines in the drawing (B, arrows). The points and contour lines were digitized and served as a basis for the 3-D reconstructions. Scale bar, 100 μm.

