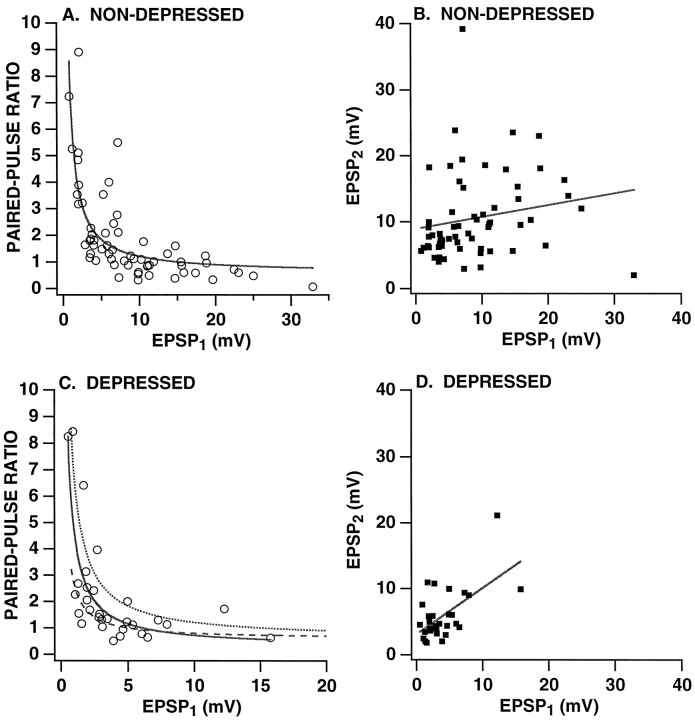
Fig. 2.
Relationship between the paired-pulse ratio and the amplitude of EPSP1. The paired-pulse ratio (A, C) and the amplitude of EPSP2 (B, D) are plotted versus the amplitude of EPSP1 for nondepressed synapses (A, B) and depressed synapses (C, D). Both sets of data are for the first trial in which a synapse was tested with paired stimulation. Paired-pulse data on nondepressed synapses were obtained 10–15 min after a synapse first was identified. Synaptic depression was achieved first by stimulating an SN to fire 15 single action potentials at a 15 sec ITI; this protocol reduced synaptic strength to an average of 32.8 ± 1.6% of the initial amplitude (see Fig.4A for data on the time course of depression for these same synapses). The paired-pulse test was 15 sec after the fifteenth SN spike. For A and C, the data were fit with hyperbolic functions of the form a +b/x, where x is the amplitude of EPSP1 (solid lines). InC, the dotted curve is the hyperbolic fit for nondepressed synapses from A; the dashed curve is the curve from A transformed by multiplying x by the average depression ratio (i.e., 0.328). In B and D, the data were fit with straight lines with a slope of 0.18 (with a correlation coefficient of 0.18) for the nondepressed synapses (B) and with a slope of 0.71 (with a correlation coefficient of 0.61) for the depressed synapses (D). Note that, whereas there is an inverse correlation between the paired-pulse ratio and the amplitude of EPSP1, the amplitude of EPSP1 is not negatively correlated with EPSP2.

