
Fig. 2.
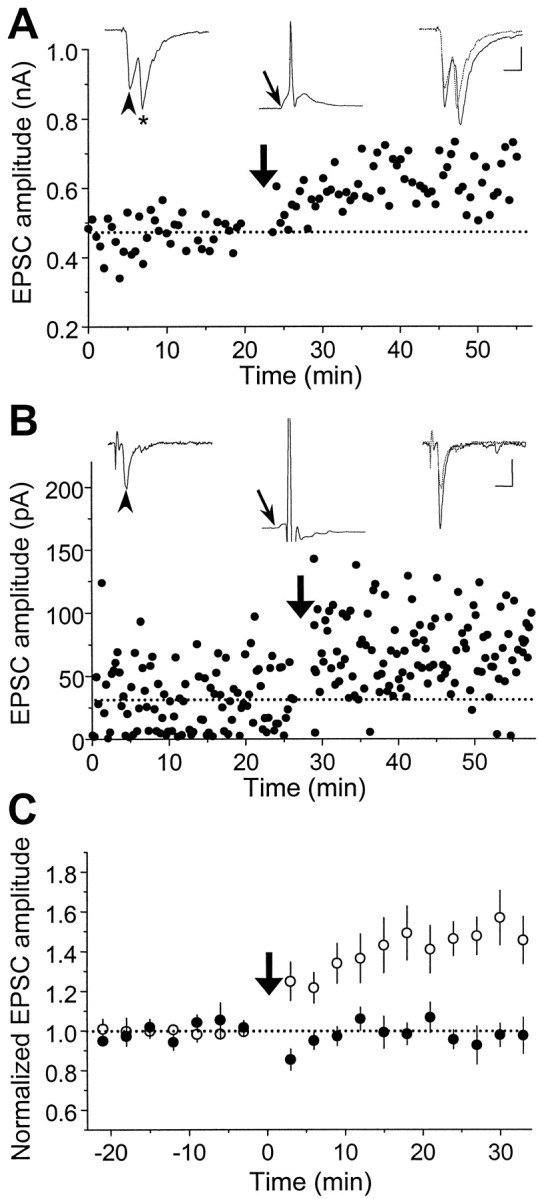
Synaptic potentiation induced by repetitive presynaptic stimulation with “positively correlated postsynaptic spiking.” A, Results obtained from a pair of glutamatergic neurons in hippocampal culture. Data points depict the amplitude of monosynaptic EPSCs induced by test stimuli (0.03 Hz,Vc = −70 mV) before and after repetitive stimulation of the presynaptic neuron (60 pulses at 1 Hz, marked by thethick arrow), with both neurons held in current clamp. Traces of EPSCs (average of 5–10 consecutive events) 5 min before (left) and 20 min after (right) the repetitive stimulation are shown above, with the 5 min trace (dashed line) superimposed onto the latter.Arrowheads mark the EPSCs being studied. * indicates a polysynaptic EPSC. The EPSP (with its onset time marked by thethin arrow) and the spike recorded during one cycle of the repetitive stimulation are depicted by the middle trace above. Note that each presynaptic stimulus was capable of initiating an action potential that peaked at ∼5 msec after the onset of the EPSP. Calibration: 200 pA, 10 msec for EPSCs; 40 mV, 10 msec for EPSPs.B, Results obtained from another pair of glutamatergic neurons. In this case, during each cycle of repetitive stimulation, the EPSP was subthreshold, and a depolarizing current pulse (2 nA, 2 msec) was injected into the postsynaptic neuron after the presynaptic activation to induce a spike that peaked at ∼5 msec after the onset of the EPSP. Calibration: 20 pA, 10 msec for EPSCs; 20 mV, 10 msec for EPSPs. C, Summary of all experiments with positively correlated postsynaptic spiking similar to that described inA and B in the absence (○,n = 14) or presence (•, n = 5) of d-AP-5 (25 μm). Data from all synaptic connections with initial EPSC amplitude smaller than 500 pA were included in the analysis. The amplitude of EPSCs from each experiment was grouped with a 3 min bin size and normalized to the mean value (dotted line) recorded before the repetitive stimulation. Data points represent mean ± SEM. The mean percentage change in synaptic strength after induction was 48.4 ± 9.9% (±SEM) and −2.3 ± 4.9% (±SEM) for experiments in the absence and presence of d-AP-5, respectively. Percentage change of each experiment was calculated from the mean EPSC amplitude 20–30 min after the induction protocol. When compared with the baseline value before induction, significant potentiation was observed in the absence of d-AP-5 (p < 0.001, t test) but not in the presence ofd-AP-5 (p > 0.1,t test).