
Fig. 6.
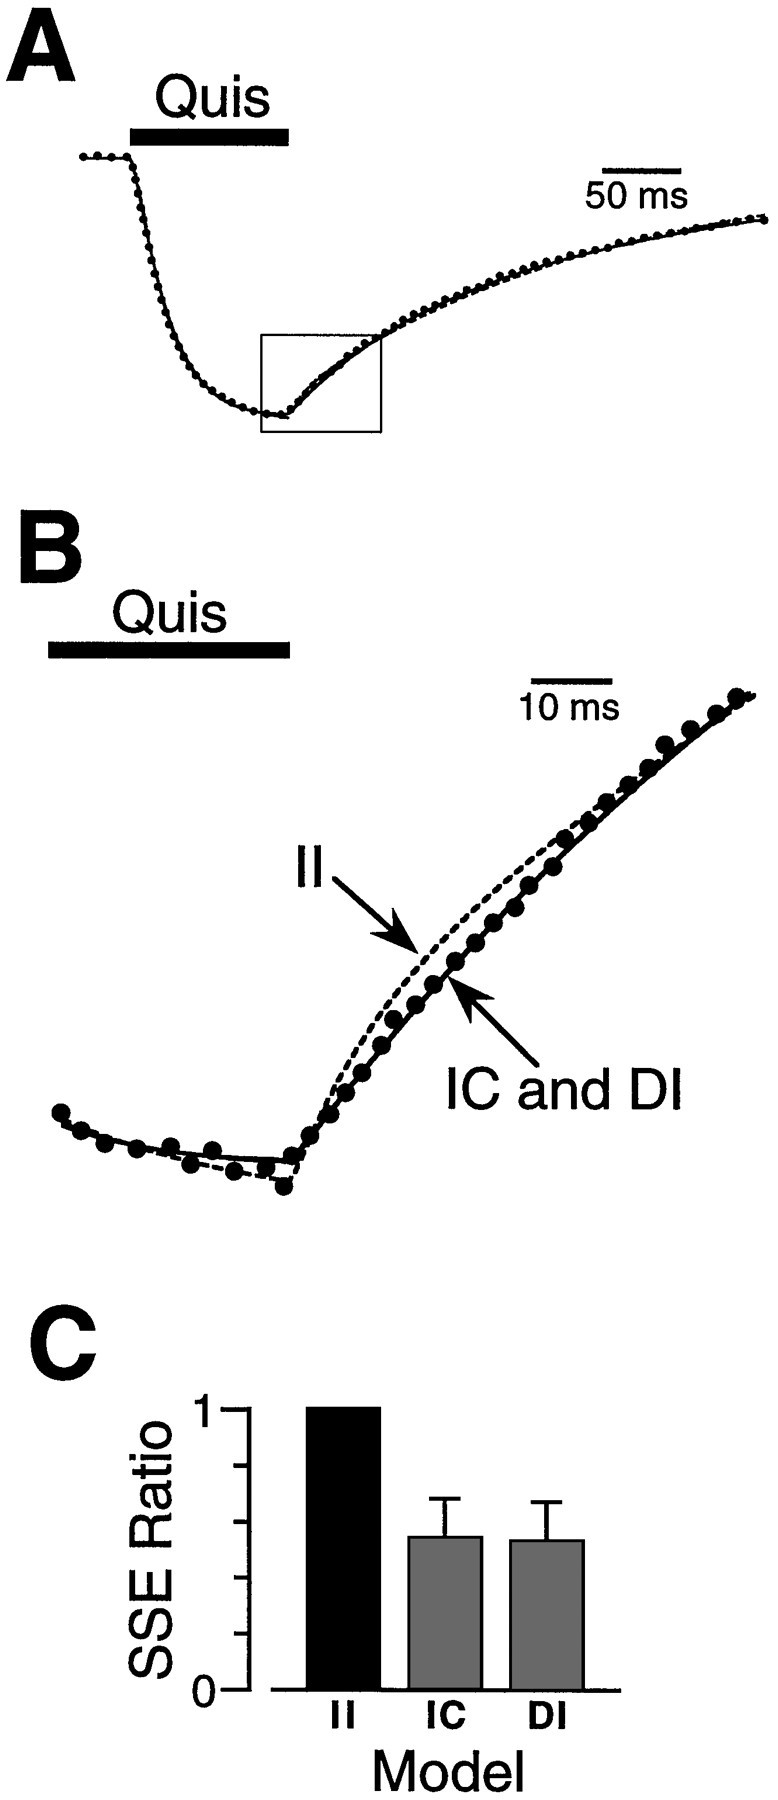
Quisqualate (Quis) deactivation kinetics show that the two agonist binding sites are unequal.A, The response to a pulse (100 msec) of quisqualate (10 μm) (dots) was fitted with three different kinetic models describing identical independent (II), different independent (DI), and identical cooperative (IC) agonist binding sites (lines). The fits diverged in the early part of the deactivation phase after the removal of agonist (box).B, An enlargement of the boxed area inA during agonist unbinding (deactivation). The optimally fitted transients are shown as a dashed line for theII model and solid lines for theDI and IC models. C, The mean SSE ratios for the responses from 13 patches are shown in thehistogram. The IC and DImodels gave better fits to the deactivation phase of the response than the II model.