
Fig. 3.
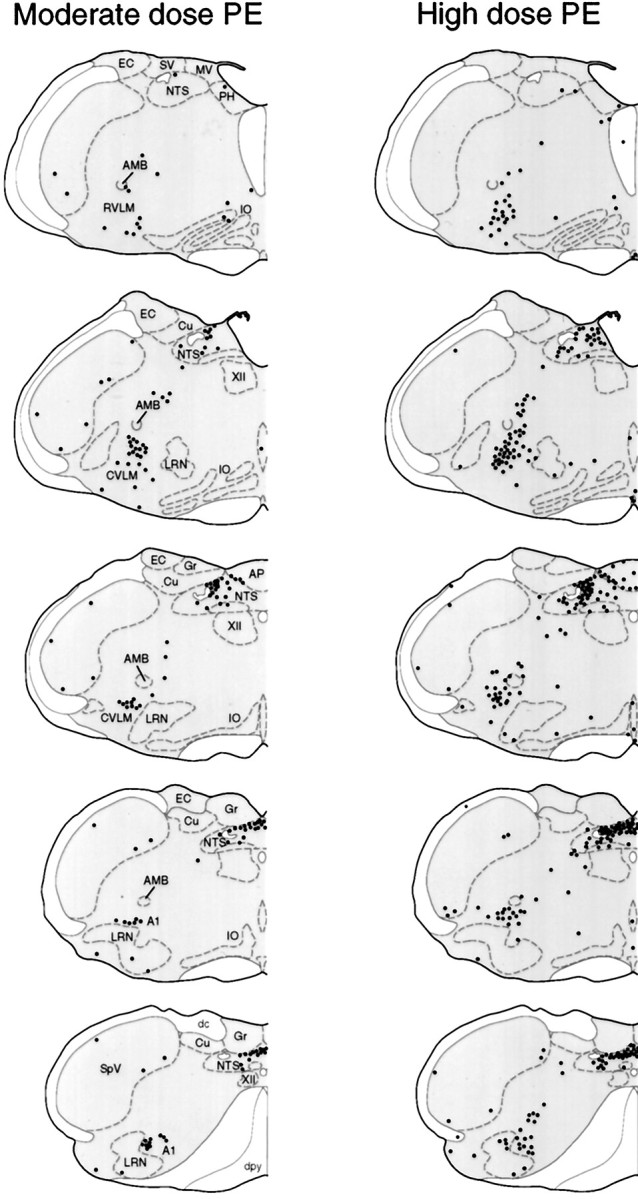
Dose-related patterns of PE-induced Fos-IR expression in medullary neurons. Line drawings of coronal sections through the medulla showing the distribution of Fos-IR nuclei (black dots) at 2 hr after hypertensive challenges induced by moderate (left) or higher (right) doses of PE. In addition to a dose-related increase in Fos-IR neurons in the baroreceptor strip of commissural NTS and the CVLM region, high dose PE also provoked a more-pronounced Fos induction in the medial subnucleus of NTS and in the lateral reticular nucleus and medullary raphe nuclei. A1, A1 noradrenergic cell group; AMB, nucleus ambiguus; AP, area postrema; Cu, cuneate nucleus; dc, dorsal column; dpy, pyramidal decussation;EC, external cuneate nucleus; Gr, gracile nucleus; IO, inferior olive; LRN, lateral reticular nucleus; MV, medial vestibular nucleus;NTS, nucleus of solitary tract; PH, prepositus nucleus; py, pyramidal tract;RVLM, rostral ventrolateral medulla;CVLM, caudal depressor region; SpV, spinal trigeminal nucleus; SV, spinal vestibular nucleus; XII, hypoglossal nucleus.