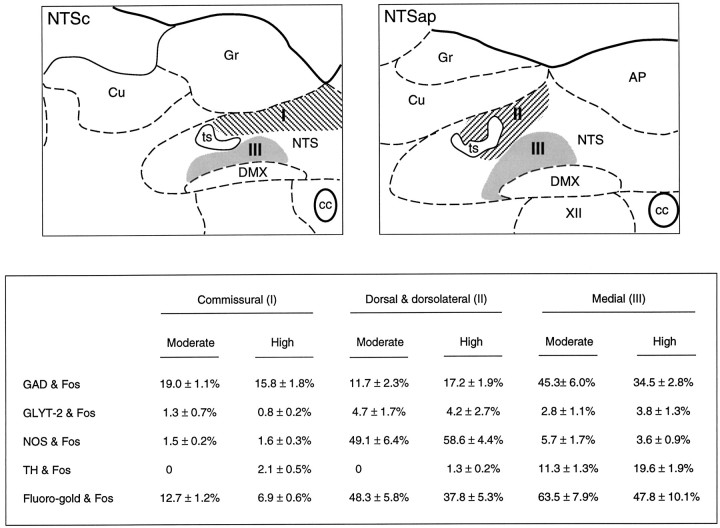
Fig. 4.
Phenotypic characterization of PE-sensitive neurons in NTS. Top, Schematic drawings of the NTS depicting the subregions in which PE-induced Fos-IR neurons were characterized. These include the dorsal aspect of the commissural division (I) at caudal levels (NTSc; left), the dorsal and dorsolateral subnuclei (II) at the level of the area postrema (NTSap;right), and the medial subnucleus (III) at both levels. Bottom, Comparison of the proportion of Fos-IR neurons within these aspects of the NTS that were colabeled for GAD or GLYT-2 mRNAs, TH-IR, or a retrograde tracer (Fluorogold) after deposits in the RVLM. Data from animals treated with moderate or higher doses of PE are given.AP, Area postrema; cc, central canal;Cu, cuneate nucleus; DMX, dorsal motor nucleus of vagus; Gr, gracile nucleus;NTS, nucleus of solitary tract; ts, solitary tract; XII, hypoglossal nucleus.

