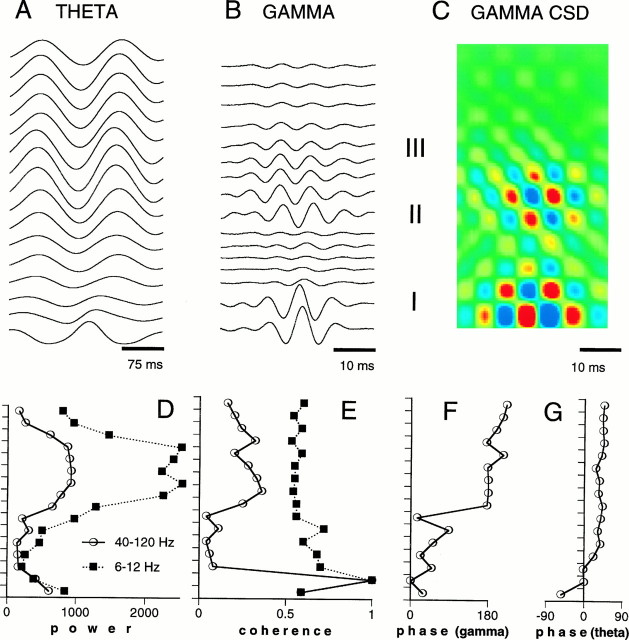
Fig. 2.
Depth versus amplitude profiles of theta and gamma oscillations in the entorhinal cortex. A, B, Averaged extracellular field potentials illustrating theta and gamma oscillations across layers I–III of the entorhinal cortex. The averager was triggered by the positive peaks of filtered (1–20 Hz; 50–150 Hz) waves recorded from site 1 (bottom trace). The wide null zone of gamma waves is attributable to the oblique penetration of the recording silicon probe (shown in Fig. 1).C, Corresponding current source density analysis of gamma oscillation. Cold colors; Sinks; hot colors, sources. D–G, Laminar distribution of power, coherence, and phases of theta and gamma oscillations. Coherence and phase measurements are relative to site 2 frombottom. The values indicate summed values from the spectra from 6 to 12 Hz (theta) and 40 to 120 Hz (gamma). Note phase reversal of gamma oscillation between layers I and II.

