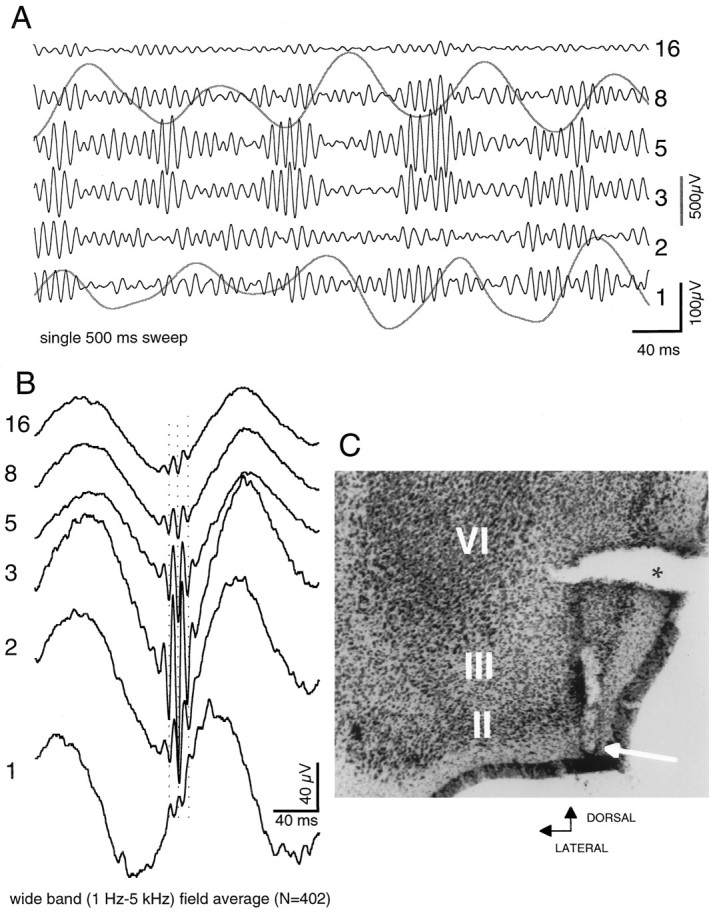
Fig. 3.

Relation of entorhinal theta to entorhinal gamma.A, Single sweep illustrating theta and gamma waves in the entorhinal cortex at six recording positions along the axis of a 16-site recording probe. Six black traces are gamma-filtered (50–150 Hz); two gray traces show concurrent theta waves (1–20 Hz). Numerals atright refer to recording positions on silicon probe. Theta records at positions 1 (layer I) and8 (layer III) are from same sites as gamma traces shown. Note amplitude variation of gamma oscillation at different recording sites. Note also the prominent relation between phase of theta and the amplitude gamma waves. B, Averaged (n = 402) extracellular field potentials (wide band) as triggered from negative peaks of local gamma oscillation (at site 3). Note the sudden phase reversal of gamma waves between sites 1 and 2. C, arrow, Recording site 1; asterisk, tissue tear.
