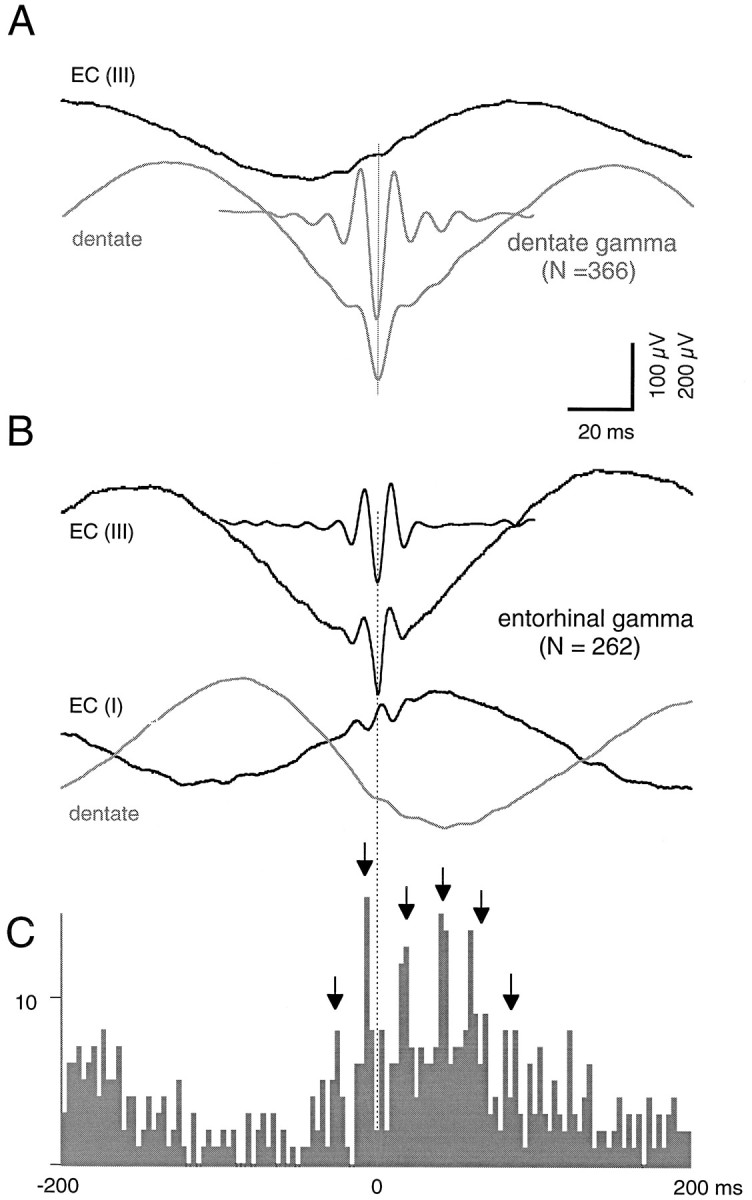
Fig. 4.

Synchrony between theta and gamma oscillations recorded within layers I–III of caudalateral entorhinal cortex and ipsilateral dentate region. A, Averaged field potentials (n = 366) from the dentate hilar region (gray traces) and layer III of EC (black trace), triggered by negative peaks of dentate gamma oscillation (short trace; filtered 50–150 Hz).B, Averaged field potentials (n = 262) from EC layers III and I (black traces) and ipsilateral dentate hilus (gray trace) triggered by negative peaks (layer III) of entorhinal gamma oscillation (short trace; filtered 50–150 Hz). C, Cross-correlogram between entorhinal gamma waves and dentate gamma oscillation. The 0 (reference) point was the negative peak of filtered layer III gamma waves. Arrows point to multiple peaks in cross-correlogram, emphasizing the transient synchronicity in the entorhinal and hippocampal oscillators.
