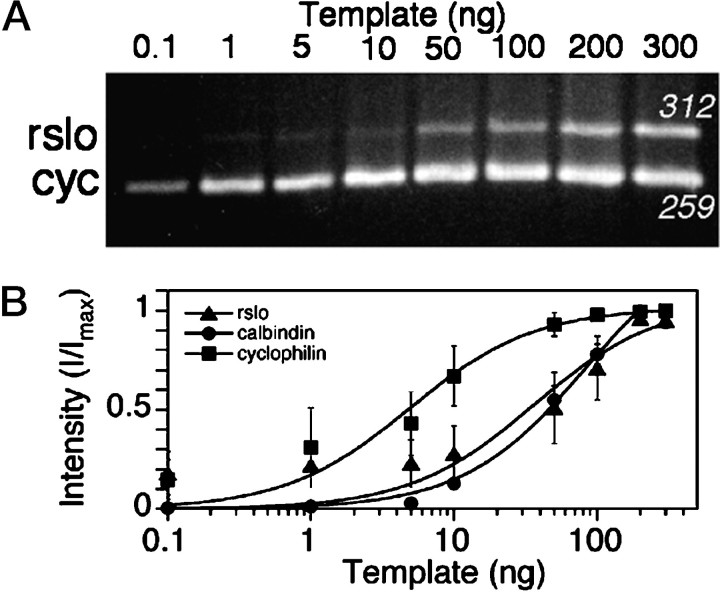
Fig. 3.
PCR analysis of the dose-dependent amplification of rslo, calbindin, and cyclophilin sequences from reverse-transcribed RNA isolated from cerebellar cultures.A, Example of a gel showing PCR products generated from a dilution series of template, using sequence-specific primers forrslo and cyclophilin (cyc), is shown. Products stained with ethidium bromide were seen at the expected sizes (rslo at 312 bp; cyclophilin at 259 bp) and showed a dose-dependent relationship to the amount of template. Template for the analysis was prepared from cytoplasmic RNA of rat cerebellar cell cultures at 4 d in vitro for cyclophilin and 7 d in vitro for rslo. Comparable results were obtained from replicate analyses of rslo and calbindin, amplified in parallel with cyclophilin. B, Relative signal intensities of the PCR products were summed for uniform areas by NIH Image software, adjusted by subtraction of adjacent background values, and plotted as a proportion of the maximum signal as a function of template concentration. The maximum signal (Imax) was set as the intensity of the product at saturating amounts of template. Lines were fit using:I = Imax *[C]/(K0.5 + [C]), where I is the measured intensity and C is the concentration of template (nanograms per 50 μl). Data are mean ± SE from triplicate experiments.

