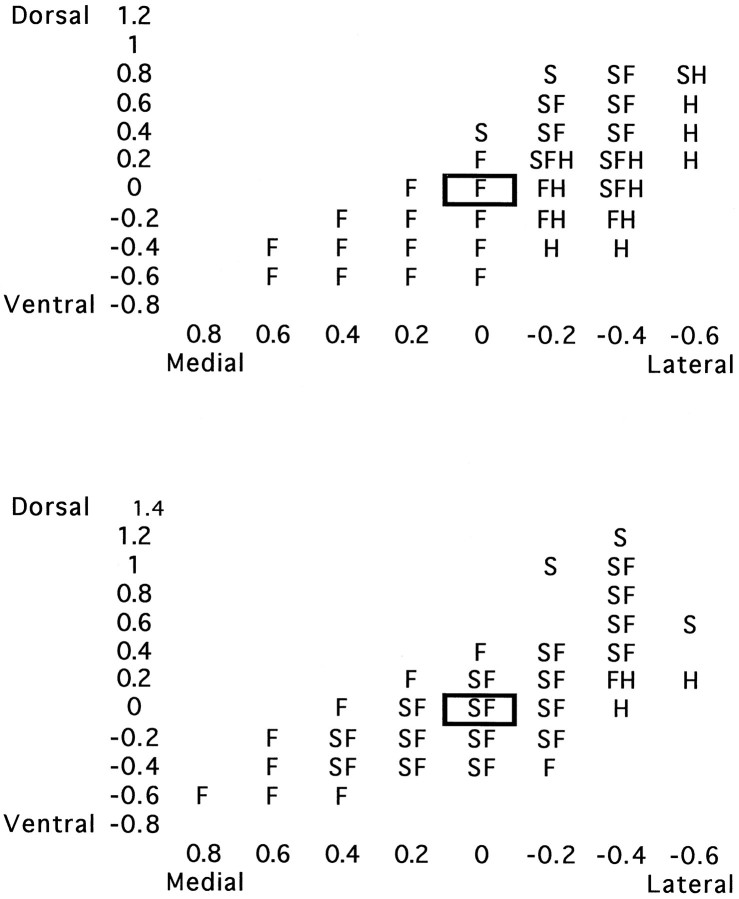
Fig. 1.
Sample data from control (top) and lesioned (bottom) animals mapped with vertical electrode penetrations. This is a coronal view of a functional map, depicting classifications of recording sites for all body regions examined (H, hindlimb; F, forepaw;S, shoulder). The forepaw centroid in this plane is the cell with a bold border. For clarity, “blank” recording site designations are omitted.

